 Home
Home|
Table of Content Volume 7 Issue 1 - July 2018
A cross-sectional study of standing height, sitting height and total lower limb length as indicator of growth among school children of Gond tribe boys of Pathria block, Mungeli district Chhattisgarh, India
Dharam Singh Rathia1, Praveen Kumar Banjare2*, R N Das3, Sudha Deshpandey4
1Assistant Professor, Department of Anatomy ESI-PGIMSR, ESIC Medical College and Hospital Joka Kolkata West Bengal, INDIA. 2Assistant Professor, 4Ex- Associate Professor, Department of Anatomy Pt. J. N. M. Medical College, Ayush and health science University, Raipur, Chhattisgarh, INDIA. 3Medical officer, CHC Bhatapara, District- Balodabajar-Bhatapara, Chhattisgarh, INDIA. Email: pravnbn@gmail.com
Abstract Background: Standing height, sitting height and total lower limb length are very important dimension of human body. It indicates longitudinal growth of human long bones and gives approximate timing of epiphysis fusion. Aim: Determine the standing and sitting height and lower limb length 5+ to 18+ year’s male. Analyze and compare the age category wise differences for boys between age group 5+ to 13+ and 14+ to 18+. Material and Method: Stature was measured using standard protocols. Growth rate was calculated age group wise comparison has been done. Results -In present study for all age group standing height [Sd. H], sitting height [St. H] and total lower limb length [TLEL] increases with the increment of age. Maximum spurt Sd. H was observed in 7+ years age group i.e. 14.04. per year. Maximum spurt of St. H was observed in 6+ years age group i.e. 8.96 cm per year. Maximum spurt of TLLL was observed in 7+ year’s age group i.e. 11.9. cm per year. Conclusion: Present study provides useful data of standing height, sitting height and total lower limb length and rate of growth and pattern of change for children aged 5+To 18+ years. Since this investigation was only for male students; the same can be done with female also. Further detailed longitudinal study is recommended to see growth pattern and find correlation between growth rate of upper body segment and lower body segment as measured in much appropriate view. Key Words: Sitting Height, Standing Height, Total Lower Limb Length, Gond Tribe Boys Anthropometry.
INTRODUCTION Growth of limbs accelerates during five year age till puberty.1 Data of stature, lower extremity length and growth during this period is important for few of orthopedic surgery like Timing of epiphysiodesis. It is also useful for anthropologist and forensic expert for height estimation and determination of age. “Growth is a complex and well-synchronized phenomenon that dictates the final stature and proportions in adult life. In order to facilitate our comprehension of process of growth we may conveniently separate growth into four time periods: 1. Antenatal growth, 2. Birth to five years of age, 3. five years of age to puberty 4. Puberty”.1 Amongst above classified periods, 5 years of age to puberty and Puberty are significant for growth study and for determination time of epiphysis fusion also for age estimation. According to the article published by Department of education and early childhood development, Royal children’s hospital Melbourne2, there are many factor such as genetics, ethnicity, nutrition, hormones, Environment birth weight, and prematurity affecting growth of individuals. Genetics is a major factor in determining the growth of individuals Parental size has a direct influence on a child’s growth potential and their predicted adult height; more so for height than weight. A child with short stature may be of concern because of possible illness or poor nutrition, but for a short child with short parents they are possibly genetically small. Average height is relevant to the measurement of the health and wellness (standard of living and quality of life) of populations. Height, like other phenotypic traits, is determined by a combination of genetics and environmental factors. A child's height based on parental heights is subject to regression toward the mean, therefore extremely tall or short parents will likely have correspondingly taller or shorter offspring, but their offspring will also likely be closer to average height than the parents themselves. Genetic potential and a number of hormones, minus illness, is a basic determinant for height. Other factors include the genetic response to external factors such as diet, exercise, environment, and life circumstances. According to different studies, bones are commonly used for stature estimation and long bones are strongly proposed. However, lower limb measurements have more directly correlation with stature than upper limbs3. The multiple regression models generated using LLL, LL and TROCH put together provided the best/highest accuracy of determination in the overall population while LL and TL gave that of the males.4 Height is an indicator of nutritional and health status of the individual and the community at large. Changes in the mean height of a community over a period of 5-10 years or more (secular trend) reflect changes in the nutritional and health status of that community. Changes in the height of an individual over a period of 3-12 months (height velocity) reflect changes in the nutritional and health status of that individual. The height and height velocity of an individual can be used in screening for a variety of health and nutritional disorders and can be used to monitor response to therapy. The height spurt begins at age 11 years but increases rapidly between ages 12 and 13, with the peak height velocity reached at age 131/2 years. The period of pubertal development lasts much longer in boys and may not be completed until age 18 years. The height velocity is higher in males (8–11 cm/y) than in females (6.5–9.5 cm/y).5
MATERIAL AND METHODS Standing height, sitting height and total lower limb length were measured using standard protocols. [6-8]Total 279 Gond tribe boys were selected as subjects for the study. The data were collected on students of school. Children of schools of Patharia block, Chhattisgarh. Boys, 5+ to18+ yrs age group male and apparently healthy were included and females, apparently ill child. and boys belonging to other scheduled tribes were excluded from study. They were grouped into two groups- 5+ to 13+ and14+ to18+ age group.
Descriptive analysis was carried out and comparative statistics was used to observe changes on various anthropometric measurements and mean, standard deviation, was computed to see the relationship between variables. Growth rate was calculated age group wise comparison has been done. SPSS was used to compute data. Analysis was done by using Windows Microsoft Excel and SPSS.
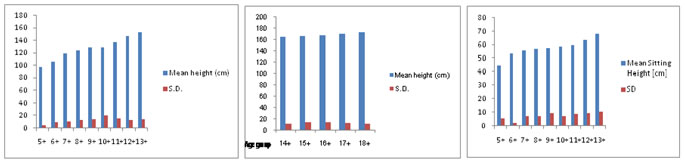
OBSEVATIONS AND RESULT Standing height [Sd.H.] In present study for all age group standing height increases with the increment of age. The standing height increases from 97.26 to 153.89 cm in among 5+ to13+ age group boys. The standing height increases from 165.97 to 173.87 cm in among 14+ to 18+ age group boys. Maximum spurt was observed in 7+ and 14+ years age group i.e. 14.04. and12.08 cm per year. Average growth rate among 5+ to13+ age group was 7.07 cm per year and14+ to 18+ age group was 3.99cm per year. [TABLE 1 - 2 Fig. 1-2] Table 1: Mean height (cm) and growth rate in cm/year
Table 2: Mean height (cm) and growth rate in cm/year
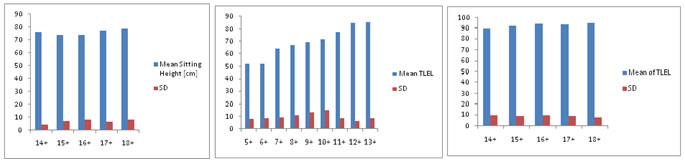
Sitting height [St.H] The Sitting height increases from 44.58 to 153 cm in among 5+ to13+ age group boys. The Sitting height increases from 165.97 to 68.32 cm in among 5+ to 18+ age group boys. Maximum spurt was observed in 6+ year’s age group i.e. 8.96 cm per year. Average growth rate among 5+ to13+ age group was 2.96 cm per year and 14+ to 18+ age group was 2.11 cm per year.[Table no. 3-4 and Fig. 3-4] Table 3: Mean Sitting height (cm) and growth rate in cm/year
Table 4: Mean sitting height (cm) and growth rate in cm/year
Total Lower Extremity Length [TLEL]: The TLEL increases from 52.68 to 77.83 cm in among 5+ to13+ age group boys. The TLEL increases from 90.12 cm to 95 cm in among 14+ to 18+ age group boys. Maximum spurt was observed in 7+ year’s age group i.e. 11.9. cm per year. Average growth rate among 5+ to13+ age group was 4.11cm per year and 14+ to 18+ age group was 1.88 cm per year.[Table no. 5-6, Fig. 5-6 ] Table 5: Mean total lower limb length [TLLL] (cm) and growth rate in cm/year
Table 6: Mean Total Lower Limb Length [TLLL](cm) and growth rate in cm/year
Figure 1 Figure 2 Figure 3 Figure 4 Figure 5 Figure 6 Legend Figure 1: Increasing mean height as per age group (5+ to 13+ age group); Figure 2: Increasing mean height as per age group; Figure 3: Increasing mean sitting height as per age group; Figure 4: Increasing mean height as per age group; Figure 5: Increasing total lower limb length [TLLL]as per age group; Figure 6: Increasing Total Lower Limb Length [TLLL] as per age group
In present study for all age group standing height, Sitting height and TLEL increases with the increment of age. The standing height increases from 97.26 to 153.89 cm in among 5+ to13+ age group boys and from 165.97 to 173.87 cm in among 14+ to 18+ age group boys. The Sitting height increases from 44.58 to 153 cm in among 5+ to13+ age group boys. and from 165.97 to 68.32 cm in among 5+ to 18+ age group boys. The TLEL increases from 52.68 to 77.83 cm in among 5+ to13+ age group boys and from 90.12 cm to 95 cm in among 14+ to 18+ age group boys. Maximum spurt standing height was observed in 7+ years age group i.e. 14.04. per year. Maximum spurt of sitting height was observed in 6+ years age group i.e. 8.96 cm per year. Maximum spurt of TLLL was observed in 7+ year’s age group i.e. 11.9. cm per year.
DISCUSSION This study provides useful data of standing height, sitting height and total lower limb length and rate of growth and pattern of change for children aged 5+To 18+ years. As per National Health and Nutrition Examination Survey (NHANES),anthropometry is a key component of nutritional status assessment in children and adults. Anthropometric data for children reflect general health status, dietary adequacy, and growth and development over time. In adults, body measurement data are used to evaluate health and dietary status, disease risk, and body composition changes that occur over the adult life-span. According to NHANES III ‘nutrition is a major determinant of health, and the resolution of many nutritional issues of public health concern require surveydata’.9 Woodruff and Duffield based on their study ‘anthropometric assessment of nutritional status in adolescent populations in humanitarian emergencies’ observed that the use of anthropometry may be more difficult in adolescents than in other age groups because anthropometric indices in normally nourished adolescents change with age and sexual development. Moreover, survey and reference populations may differ in the age at which certain pubertal landmarks are attained, requiring adjustment for differences between survey and reference populations.10 Standing height is estimated from various other anthropometric dimensions by anthropologist and forensic experts. Lower limb length is important amongst them. Growth rate estimation is also important for few orthopedic surgeries like Timing of epiphysiodesis, asper study of Paula M. Kelly and Alain Dime ´glio “From 5 years to the onset of puberty, growth velocity stabilizes. The standing height increases from 108 to153 cm in boys and from 107 to 143 cm in girls.. The annual growth velocity of the standing height reduces to 5.5 cm/year, of which 3.2 cm/year is the sub-ischial length, i.e. 65% of height gain is from the lower limbs versus only 35% from the sitting height during this period. The final growth spurt before skeletal maturity commences at the onset of puberty. This starts at 13 years of bone age for boys and 11 years of bone age for girls. Growth velocity increases from 5.5 to 7.8 cm/year. Standing height increases from 153 cm (±1 cm) to 175 cm (±1 cm) in boys and from 142 cm (±1 cm) to 162 cm (±1 cm) in girls.”1 The sitting height reliably predicts standing height in both genders; but, not reliably enough as arm span.11 The lower limb length and foot length provided the reliability and accuracy in estimating stature with the use of regression equation.12 These studies shows that standing height and sitting height are positively correlated but utmost care should be taken while estimating height of children’s below 13 year age group as there is difference in growth rate of upper body segment as measured by sitting height and lower body segment as measured by total lower limb length.
CONCLUSION In conclusion, our data define growth patterns for children aged 5+To 18+ years in school children of Gond Tribe boys of Pathria Block Mungeli district Chhattisgarh. In the present study, an attempt was made to derive few useful data of height of Gond tribe boys mungeli district CG. Compare them to find out rate of growth and pattern of change. This investigation was only for male students; the same can be done with female also. Further detailed longitudinal study is recommended to see growth pattern and find correlation between growth rate of upper body segment and lower body segment as measured in much appropriate view.
REFERENCES
|
|
|||||||||||||||||||||||||||||||||||||||||||||||||||||||||||||||||||||||||||||||||||||||||||||||||||||||||||||||||||||||||||||||||||||||||||||||||||||||||||||||||||||||||||||||||||||||||||||||||||||||||||||||||||||||||||||||||||||||||||||||||||||||||||||||||||||||||||||||
 This work is licensed under a Creative Commons Attribution-NonCommercial 4.0 International License.