 Home
HomeOfficial Journals By StatPerson Publication
|
Table of Content - Volume 4 Issue 1 - October2017
Fasting blood sugar and post prandial blood sugar among diabetics at a tertiary care hospital
Kirankumar Akka1, Vinod V Wali2*
1Assistant Professor, Department of Biochemistry, MRMC, Gulbarga, Karnataka, INDIA. 2Associate Professor, Department of Biochemistry, Smt Kashibai Navale Medical College and General Hospital, Pune, Maharashtra, INDIA. Email: docvinod80@yahoo.com
Abstract Background: Patients with IFG and IGT are now referred to as having ‘pre-diabetes’ indicating relatively high risk for development of diabetes in these patients. In the absence of pregnancy, IFG and IGT are risk factors for future diabetes as well as cardiovascular disease. IFG/IGT are associated with metabolic syndrome, which includes obesity (especially abdominal), dyslipidemia of high triglyceride/low HDL type, and hypertension. Medical nutrition therapy aimed at producing 5-10% of weight loss and exercise, have been variably demonstrated to prevent or delay the development of diabetes in people with IGT. Methodology: A detailed clinical history was obtained from the patients. The detailed history suggestive of symptoms including polyuria, polydypsia, polyphagia and weight loss were recorded in a predesigned proforma. All the patients’ blood sample were sent for estimation of FBS, PPBS and HbA1c levels. Results: The correlation coefficient between FBS and HbA1c was 0.722 and between HbA1c and PPBS was 0.829. There was a positive and significant coefficient between the FBS, PPBS and HbA1c levels. Conclusion: About 65.3% of the subjects with abnormal PPBS had abnormal HbA1cand 34.7% had normal HbA1c. All the patients with normal PPBS also had normal HbA1c. Keywords: Fasting Blood Sugar, Post Prandial Blood Sugar, Diabetics
INTRODUCTION Diabetes mellitus is a group of metabolic diseases characterized by hyperglycemia, resulting from defects in insulin secretion, insulin action or both. The metabolic dysregulation associated with diabetes mellitus causes secondary pathophysiological changes in multiple organ systems. With an increasing incidence worldwide, diabetes mellitus will be the leading cause of morbidity and mortality in the future.1 The expert committee recognized an intermediate group of subjects whose glucose levels, although not meeting criteria for diabetes, are nevertheless too high to be considered normal. This group is defined as having fasting plasma glucose (FPG) levels between 100 mg /d (5.6 mmol/l) and 125 mg% (7.0 mmol/l), IFG, or 2 hr values of oral glucose tolerance test (OGTT) of ≥ 140 mg/dl (7.8 mmol / l) but < 200 mg /dl (11.5 mmol/l), IGT.2 Thus categories of FPG values are as follows:
Corresponding categories when OGTT is used
= Normal glucose tolerance
= IGT (Impaired glucose tolerance)
Patients with IFG and IGT are now referred to as having ‘pre-diabetes’ indicating relatively high risk for development of diabetes in these patients. In the absence of pregnancy, IFG and IGT are risk factors for future diabetes as well as cardiovascular disease. IFG/IGT are associated with metabolic syndrome, which includes obesity (especially abdominal), dyslipidemia of high triglyceride/low HDL type, and hypertension. Medical nutrition therapy aimed at producing 5-10% of weight loss and exercise, have been variably demonstrated to prevent or delay the development of diabetes in people with IGT.3,4 Chronic hyperglycemia in Diabetes mellitus results both microvascular and macrovascular complications. The microvascular complications include retinopathy, nephropathy and neuropathy. The Macrovascular complications are manifested as coronary artery disease or cerebrovascular disease. The studies have revealed that microvascular complications are mainly because of hyperglycemia, whereas insulin resistance is the major determinant in macrovascular disease. Atherosclerosis is the pathological entity in macrovascular disease.5 The increase in HbA1c from 5.5% to 9.5% results in 10 fold increase in the in risk for microvascular disease end points. In contrast, over the same HbA1c range, macrovascular risk increases only about twofold. Hence hyperglycemia is not the major determinant of diabetic macrovascular disease. Insulin resistance is the main pathophysiologic abnormality found in these patients. Insulin resistance causes mitochondrial overproduction of ROS in macrovascular endothelial cells by increasing FFA flux and oxidation. And, as with hyperglycemia, this FFA-induced increase in ROS activates the same damaging pathways: AGEs, PKC and hexosamine pathway.6
METHODOLOGY A detailed clinical history was obtained from the patients. The detailed history suggestive of symptoms including polyuria, polydypsia, polyphagia and weight loss were recorded in a predesigned proforma. All the patients’ blood sample were sent for estimation of FBS, PPBS and HbA1c levels. Inclusion criteria:
Exclusion criteria:
RESULTS Table 1: Distribution of the study group according to age and mean FBS, PPBS, HbA1c
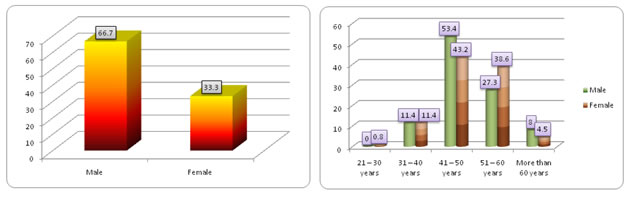
The mean (± SD) FBS levels of subjects of this study was 155.42 (± 44.99) mg /dl. The subjects belonging to more than 60 years age group had mean (± SD) FBS levels of 190.0 (±77.78) mg/dl, 31 – 40 years was 166.47 (± 50.78) mg/dl and 41 – 50 years was 156.45 (± 45.12) mg/dl. The mean (± SD) PPBS levels in the study group was 224.15 (± 39.84) mg/dl. The mean PPBS levels in subjects of more than 60 years was 247.11 (± 67.93) mg/dl, 31 – 40 years was 225.93 (± 45.33) mg/dl, 41 – 50 years was 224.98 (± 40.38) mg/dl. The mean HbA1c levels in the study group was 7.57 (± 0.97) percent. The mean (± SD) of HbA1c level was high in more than 60 years of age group and lesser in subjects aged between 21 – 30 years. There was a significant difference between the mean FBS levels in different age group patients. However, there was no significant difference between the PPBS levels and HbA1c levels in subjects of different age group. Figure 1: Distribution of the study group according to sex Figure 2: Distribution of the study group according to age and sex In this study, about 66.7% of the study subjects were males and 33.3% were females. About 53.4% of the males and 43.2% of females belonged to 41 – 50 years age. About 27.3% of the males belonged to 51 – 60 years, 11.4% belonged to 31 – 40 years and 8% belonged to more than 60 years of age group. Among females, 38.6% belonged to 51 – 60 years, 11.4% belonged to 31 – 40 years and 4.5% belonged to more than 60 years of age group.
Table 2: Distribution of the study group according to sex and mean FBS, PPBS, HbA1c
The mean (± SD) of FBS among males was 157.4 (± 48.98) mg/dl and among females was 151.45 (± 35.9) mg/dl. There was no significant difference between the mean FBS levels of males and females. The mean (± SD) PPBS levels of males was 224.72 (± 41.36) mg/dl and females was 223.02 (± 37.04) mg/dl. There mean difference on PPBS levels of males and females was also not significant. The mean (± SD) of HbA1c was 7.59 (± 1.0) percent in males and 7.53 (± 0.9) percent in females. There was no significant difference between the HbA1c levels of males and females.
Table 3: Distribution of the study group according to correlation between FBS, PPBS and HbA1c
The correlation coefficient between FBS and HbA1c was 0.722 and between HbA1c and PPBS was 0.829. There was a positive and significant coefficient between the FBS, PPBS and HbA1c levels.
DISCUSSION In a meta analysis to determine whether a glycosylated level can be used in place of an oral glucose tolerance test (OGTT) to diagnose diabetes, Peters et al (2010)7 concluded that, although the OGTT is the "gold standard" for diagnosing diabetes, it is known to be poorly reproducible and is often not performed. The use of HbA1c is more convenient, but therapeutic decisions are based on this value, regardless of the findings on the OGTT. An HbA1c level of 7.0% or higher often requires pharmacological intervention and is most often associated with the diagnosis of diabetes by World Health Organization standards. An HbA1c level below 7.0% would generally be treated with diet and exercise, regardless of the diagnosis of IGT or diabetes by OGTT. Thus, measurement of HbA1c levels may represent a reasonable approach to identifying treatment-requiring diabetes. Melkerrin et al (1996) have assessed the use of Glycosylated Haemoglobin in the Diagnosis Diabetes Mellitus in Elderly People. They concluded that the normal range of HbA1c in elderly subjects is not markedly different from established normal values. The poor sensitivity (36%) and predictive value (44%) of abnormal HbA1 in detecting diabetes, as shown in the study, would not permit its use for screening purposes nor as a confirmatory test for diabetes in elderly subjects.8 Malkani et al concluded that A1c and plasma glucose tests are frequently discordant for diagnosing diabetes. A1C ≥6.5% identifies fewer individuals as having diabetes than glucose-based criteria. Convenience of A1C test might increase the number of patients diagnosed, but this is unproven. Diagnostic cut-points for both glucose and A1C are based on consensus judgments regarding optimal sensitivity and specificity for the complications of hyperglycemia. A1C may not accurately reflect levels of glycemia in some situations, but in comparison with glucose measurements, it has greater analytic stability and less temporal variability. When choosing a diagnostic test for diabetes, the limitations of each choice must be understood. Clinical judgment and consideration of patient preference are required to appropriately select among the diagnostic alternatives.9 In a study comprising 2,298 subjects Hu Y et al (2010) concluded that compared with FPG or HbA1c alone, the simultaneous measurement of FPG and HbA1c (FPG and/or HbA1C) might be a more sensitive and specific screening tool for identifying high-risk individuals with diabetes and IGT at an early stage.10 In twin cohort study by Incani et al (2015) 11, HbA1c ≥ 6.5% showed a sensitivity of 69% for diabetes, whereas HbA1c 5.7 – 6.4% did not identify prediabetes well in obese cohort. In diabetes screening group, HbA1c had low sensitivities for both diabetes (39.2%) and prediabetes (53.3%). The body mass indexwise stratification had shown that HbA1c agreement with the OGTT for diabetes was much higher (80%, P < 0.05) in class I – III. HbA1c agreement was much higher with the OGTT for diabetes in class I obesity compared to class II and class III obesity. In prediabetes, obesity had a low sensitivity in all classes of obesity. In Korea, Kim JM et al (2014) have studied the cut off value glycated hemoglobin (HbA1c) for fasting plasma glucose of 126 mg/dl in Korean adult population. Among 5,421 participants, without any history of diabetes mellitus, A1c threshold of 6.1% produced the highest sum of sensitivity (85.2%) and specificity (90.5%0 for FPG of 126 mg/dl. A1c of 6.5% produced a sensitivity of 67.7% and specificity of 98.p0% for FPG of 126 mg/dl. They concluded that the criteria of A1cof more than or equal to 6.5% might be the acceptable in the Korean adult population.12 In a study by Wang et al (2014), the patients undergoing coronary angiography (CAG) by using both Glycated hemoglobin (HbA1c) and oral glucose tolerance test (OGTT) to screen and to compare the performance of fasting plasma glucose (FPG), 2 – h plasma glucose (2hPG) and HbA1c for screening for AGR. A total of 689 subjects were included and according to OGTT, the prevalence rates of diabetes and prediabetes were 19.9% and 41.7% respectively. The corresponding values were 28.0% and 60.4% respectively when HbA1c was adopted as a diagnostic criterion in addition to OGTT. The area under the ROC curve (AUC) was higher for HbA1c than for FPG but was not significantly different from that for 2h PG. The AUC was higher for HbA1c than for either FPG or 2h PG. They concluded that high prevalence of previously undiagnosed AGR was reported patients admitted for CAG. HbA1c can be adopted as an alternative to OGTT for screening for AGR in patients undergoing CAG.13
CONCLUSION About 69.6% of those with abnormal HbA1c had abnormal FBS and 26.7% had normal FBS. About 30.4% of those with normal HBA1c had abnormal FBS. About 73.3% of subjects with normal FBS also had normal HbA1c. The sensitivity of HbA1c against FBS was 69.6%, specificity was 73.3%, positive predictive value was 89.9%, negative predictive value was 58.5%. The percentage of false positives was 8.9%, percentage of false negatives was 58.5%, positive likelihood ratio was 0.4 and negative likelihood ratio was 2.4.
REFERENCES
|
 This work is licensed under a Creative Commons Attribution-NonCommercial 4.0 International License.