 Home
HomeOfficial Journals By StatPerson Publication
|
Table of Content - Volume 8 Issue 2 - November 2018
S Sripriya1, Mohammed Abdullah Saad2*, P V Sathyanarayana3
1Assistant Professor, 2Tutor, Department of Biochemistry, Government Medical College, Siddipet, Telangana, INDIA. 3Professor, Department of Biochemistry, Kakatiya Medical College, Warangal, Telangana, INDIA.
Abstract Background and Objectives: Hypertension and proteinuria are being recognized to be the most common complications of pregnancy. Hypertension in pregnancy is the major cause of fetal growth retardation and perinatal mortality. Moderately significant hypocalcaemia and slightly raised creatinine levels are seen in blood of patients with pregnancy induced hypertension (PIH) compared to normal pregnant women. The urinary calcium levels are significantly decreased, and microalbuminuria is observed in gestational hypertensive patients compared to normotensive pregnant women. Aim of this study is to measure and compare the Serum Calcium, Serum Creatinine, urinary calcium / creatinine ratio and urinary microalbumin / creatinine ratio in PIH and in normal pregnant women. Methods: This case control study was done with100 patients divided into 2 groups (healthy pregnant women as controls and gestational hypertensive patients as cases, between 24-38 weeks of gestation) with inclusion and exclusion criteria. Blood and Urine samples were collected under aseptic conditions. Multiple comparisons between different groups were done using ANOVA test. Results: In present study hypocalcemia, slightly raised serum and urinary creatinine levels, hypocalciuria and microalbuminuria were observed in gestational hypertensive patients when compared to normal pregnant women. Interpretation and Conclusion: From this study, we concluded that a regular evaluation of urinary calcium/creatinine ratio and urinary microalbumin/creatinine ratio after 20 weeks of gestation can be an effective screening method for impending pre-eclampsia and may identify population at greater risk to be included in primary prevention programs. Key Words: Pre-eclampsia, Gestation induced hypertension, Proteinuria, Microalbuminuria.
INTRODUCTION Pregnancy can be the most wonderful experience life has to offer, but it can also be dangerous. Around the world, an estimated 5,29,000 women die during pregnancy or childbirth1 Pregnancy is a physiological state associated with substantial and profound alterations in metabolic and biochemical processes. If there are no complications, these biochemical changes are reversible following delivery.2 Hypertension and proteinuria have long been recognized to be very common complications of pregnancy.3 The risk of pre-eclampsia markedly increases in women with previous pre-eclampsia and in those with either pre-existing vascular disease or conditions associated with increased cardiovascular risk, including renal disease, hypertension, diabetes, thrombophilia and obesity (BMI>29)4. Hypertension in pregnancy is the major cause of fetal growth retardation and perinatal mortality.5 Regulation of intracellular calcium plays a key role in hypertension.6 Incidence of pre-eclampsia in India is reported to be 8-10% of pregnancies. In 2001, according to the National Centre for Health statistics, gestational hypertension was identified in 1,50,000 women or 3.7% of pregnancies. Regardless of parity, multiple gestations have an incidence of 30% and 7 there is a familial tendency to the development of both pre-eclampsia and eclampsia.8 Renal excretion of calcium increases during pregnancy, maximum excretion level reaches during the third trimester. Urinary excretion of calcium in pregnant women is normally in the range of 350-620 mg/day.9 Pregnant Women who develop pre-eclampsia have significantly lower serum calcium levels and higher serum creatinine levels when compared to normotensive women. There is a decrease in urinary calcium levels in pre-eclampsia. Decreased renal filtration and increased tubular reabsorption may result in hypocalciuria. Diagnosis of pre-eclampsia requires evaluation for proteinuria. The gold standard for this evaluation is the 24hr urine collection. Studies have shown the urinary dipstick is a poor predictor of 24hr urine total protein level.10 Also it is inconvenient for women and inaccurate due to incomplete collection. In recent years, random protein/creatinine ratio has been suggested as a rapid test for prediction of pre-eclampsia.11 However, customary dipstick methods for detecting proteinuria fail to detect minimal excretion of albumin that may be present before other clinical signs and symptoms of pre-eclampsia. With the recent development of Radio-immunoassay (RIA) for the detection of microalbuminuria, it is now possible to detect minimal albumin excretion that would have gone unnoticed in the past.12 Purpose of the present study is to determine the presence of hypocalcemia, raised serum creatinine, microalbuminuria or high microalbumin/creatinine ratio and hypocalciuria or low calcium/creatinine ratio as an effective screening method for impending pre-eclampsia in pregnant women.
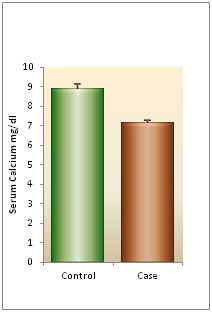
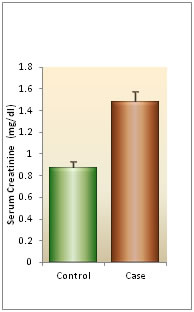
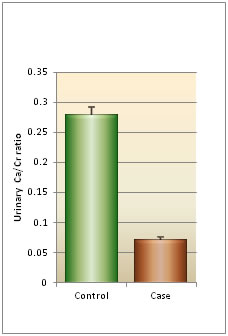
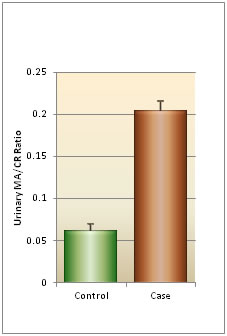
MATERIALS AND METHODS Study design: A case control analytical study Ethics approval: Approved by Ethical and Research Committee of Kakatiya Medical College, Warangal to use human subjects in the research study. Study location: Investigations were performed in the Department of Biochemistry, Mahathma Gandhi Memorial Hospital/ Kakatiya Medical College, Warangal. The study was conducted over a period of one year. Sample size: 100 subjects participated in the present study Inclusion Criteria: Included pregnant women with blood pressure above 140/90mmHg, proteinuria and pedal edema. Exclusion Criteria: Patients with history of chronic hypertension, diabetes, renal diseases, and other chronic medical illness were excluded from the study. Cases: case samples were collected from pregnancy induced hypertension patients between 24-38 weeks of gestation, from Obstetrics and Gynaecology ward, Chanda Kanthaiah Memorial Hospital, Warangal and Government Maternity Hospital, Hanmakonda (both are attached teaching hospitals of Kakatiya Medical College, Warangal) Controls: 50 healthy pregnant women samples were taken as controls Methodology: The total number of subjects in the study was 100, of which 50 were cases and 50 were controls. Majority of subjects belonged to age group between 20-24 years. The period of gestation of all subjects were between 20-34 weeks. Patients details regarding age, parity, socio-economic status, past, family, and personal history were filled in a proforma. General examination was done for blood pressure, edema and weight gain. Examination was conducted in all the cases according to the proforma. Blood and Urine samples were collected from all the study participants of each group under aseptic conditions. Estimation of calcium levels in serum and urine was done by O-Cresolophthalein Complexone method13. Estimation of creatinine levels in serum and urine was done by Alkaline Picrate method14 and estimation of urinary microalbumin was done by Turbidimetric Immunoassay15 Statistical analysis: Results were expressed as Mean ± SD. One-way ANOVA was used for multiple group comparison and student’s t-test for group wise comparisons. Relationship between variables was measured by Pearson’s correlation coefficient. A p-value of 0.05 or less was considered as statistically significant. RESULTS The Mean ± SD of all the parameters studied in cases were significantly different from those of controls (p<0.05). Mean ± SD of serum calcium in gestational hypertensive cases were lower (7.146 ± 0.705 mg/dl) when compared to controls (8.886 ± 1.557 mg/dl). Mean ± SD of urinary calcium values found in cases were lower (83.48 ± 7.28 mg/day) compared to controls (122.46 ± 9.55 mg/day). Mean ± SD of serum creatinine were higher in gestational hypertensive cases (1.482 ±0.601 mg/dl) compared to normotensive controls (0.872 ± 0.370 mg/dl). Mean ± SD of urinary creatinine values found in the cases were higher (1.21 ± 0.37 gm/day) compared to controls (0.95 ± 0.16 gm/day). Mean ± SD of urinary calcium: creatinine ratio value found in the cases were lower (0.07 ± 0.03) compared to controls (0.28 ± 0.08). Mean ± SD of urinary microalbumin: creatinine ratio value found in the cases were higher (0.21 ± 0.08) compared to controls (0.06 ± 0.05).
Table 1: Descriptive information of subjects
Table 2: Comparison of serum calcium levels between cases and controls
Table 3: Comparison of serum creatinine level between cases and controls
*- unpaired t- test, HS- highlysignificant
Table 4: Comparison of urinary calcium levels between cases and controls
Table 5: Comparison of urinary creatinine levels between cases and controls
Table 6: Comparison of urinary calcium/creatinine ratio between cases and controls
Table 7: Comparison of urinary microalbumin/creatinine ratio between cases and controls
*-unpaired t- test, HS- highly significant
Figure 1 Figure 2 Figure 1: Graphical representation of critical difference comparison; Figure 2: Graphical representation of critical difference comparison for serum creatinine for serum calcium
Figure 3: Graphical representation of critical difference comparison for urinary ca/cr ratio; Figure 4: Graphical representation of critical difference comparison for urinary MA/cr ratio
DISCUSSION Pre-eclampsia is defined as “the recorded blood pressure more than 140/90mm of Hg (a rise of 30mm Hg in systolic pressure or a 15mmHg in diastolic pressure) measured twice, 6 hrs apart at bed rest, associated with proteinuria or edema or both”.8 It can cause changes virtually in all organ systems, most notably the cardiovascular, renal, hematological and immune systems. Some of these changes are present before the clinical diagnosis of pre-eclampsia.12 Pre-eclampsia is responsible for majority of maternal and fetal complications. The predominant pathology, which is endothelial dysfunction sets in as early as 8 - 18 week, however, the signs and symptoms appear in the late mid-trimester. In order to arrest the disease process in the initial stages or to prevent complications especially in women predisposed to pre-eclampsia, various predictors have been proposed over time.16 Proteinuria and alterations in calcium excretion are common features of various forms of hypertension and renal disorders12 The parameters like serum calcium, serum creatinine, urinary calcium, urinary microalbumin, urinary creatinine and their ratios (urinary calcium/creatinine and urinary microalbumin/creatinine) were used as predictors of developing pre-eclampsia, but the reliability of their use in prediction of pre-eclampsia was not studied. The present study was undertaken to find out their reliability and to determine whether calcium/creatinine ratio and microalbumin/creatinine ratio can be used as predictors in developing pre-eclampsia. This study included 100 subjects. Among them 50 subjects were controls which included normal healthy pregnant women without any major illness after 24 weeks of gestation and 50 subjects were cases which included gestational hypertensive patients after 24 weeks of gestation. Both multiparous and nulliparous women were included in the study, but majority were nulliparous women. Pregnant women developing preeclampsia have significant lower serum calcium levels compared to normotensive pregnant women which could be due to low calcium intake in women with PIH than in those without PIH in present study. The majority of women with pre-eclampsia have diminished renal perfusion and glomerular filtration with corresponding elevated plasma creatinine. In severe cases, it may be elevated 2-3 fold over normal values in non-pregnant women.17 Urinary calcium levels were lower and mean urinary microalbumin levels were increased in gestational hypertensive patients when compared to normotensive pregnant women. Previous studies have assessed the use of urinary calcium/creatinine ratio as clinical tools for predicting which gestational hypertensive women were at risk of developing pre-eclampsia, but yielded different results.12 In the present study, the urinary calcium/creatinine ratio was lower in women with gestational hypertension when compared to normotensive pregnant women. The amount of microalbumin in the sample is compared against its concentration of creatinine (microalbumin/creatinine ratio) is the preferred test for screening microalbuminuria. This is because creatinine which is by-product of muscle metabolism is normally excreted in urine on a constant basis and levels are relatively stable. Since the concentration (or dilution) of urine varies throughout the day, this property of creatinine allows its measurement to be used as a corrective factor in random/spot samples.18 In this study, the urinary microalbumin/creatinine ratio was higher in women with gestational hypertension when compared to normotensive pregnant women.
CONCLUSION Pre-eclampsia is a complex multisystem disorder characterized by hypertension and proteinuria and has highest maternal mortality and fetal morbidity. It causes changes in all organ systems, most notably the renal system. Some of these changes in renal function are present in otherwise symptom-free patients in whom pre-eclampsia will eventually develop. Screening the deliberate examination of substantial segments of the population in search for disease at its earliest stages, is a logical extension of the role of preventive medicine and one that is becoming increasingly popular. Ideally a screening test should be inexpensive, easy to perform, readily interpretable and readily available to the entire population at risk. The study shows a close relationship between urinary calcium as well as microalbumin excretion with gestational hypertension. The current study supports that the levels of urinary calcium are significantly decreased in gestational hypertensive patients compared to normotensive pregnant women, whereas urinary microalbumin level was increased. It is also emphasized from the study that a regular evaluation of urinary calcium/creatinine ratio and urinary microalbumin/creatinine ratio after 20 weeks of gestation can be used as an effective screening method for impending pre-eclampsia and may identify population at greater risk to be included in primary prevention programs.
REFERENCES
|
||||||||||||||||||||||||||||||||||||||||||||||||||||||||||||||||||||||||||||||||||||||||||||||||||||||||||||||||||||||||||||||||||||||||||||||||||||||||||||||||||||||||||
 This work is licensed under a Creative Commons Attribution-NonCommercial 4.0 International License.