 Home
HomeOfficial Journals By StatPerson Publication
|
Table of Content - Volume 4 Issue 1 - October2017
A comparative evaluation of lipid profile and thyroid hormones in patients with type 2 diabetes mellitus: A hospital-based case control study
Sarala Devi Tenepalli1, Pawan Arun Kulkarni2*, Nagababu Pyadala3
1Associate Professor, 2Assistant Professor, Department of Biochemistry, MNR Medical College and Hospital, Sangareddy, Telangana, INDIA. 3Research Associate, MNR Foundation for Research and Innovation, Sangareddy, Telangana, INDIA. Email: nagababu00799@gmail.com
Abstract Background: The present study was undertaken to assess the relationship between lipid profile and thyroid hormones among Type 2 diabetic patients attending to teaching hospital. Materials and Methods: In the present study, 100 type 2 diabetic subjects and 100 healthy non diabetic subjects were investigated for total Triiodothyronine (T3), total thyroxin (T4), thyroid stimulating hormone (TSH), Fasting Plasma Glucose (FPG),, and glycosylated hemoglobin (HbA1c), Results: The level of TC, TG, and LDL- C were significantly higher in type 2 DM as compared to non-diabetic controls. However, T2DM study subjects had a significant lower serum HDL-C than non-diabetics controls. Moreover, significant lower T3 and T4; and higher TSH were observed among T2DM than non-diabetic subjects (P<0.0001). In addition, there were significant positive correlations between TSH and TC, LDL-C and TG, and negative correlations between TSH and HDL-C of T2DM study subjects and non-diabetic subjects. Conclusion: In the current study, low levels of thyroid hormones positively associated with a dysregulation of lipid metabolism in patients with type 2 DM attending to a rural teaching hospital. Therefore we recommend continuous screening of thyroid hormones is suggested in type 2 DM to reduce the risk of thyroid hormone dysfunctions and vascular complications and also helps in the management of diabetes. Key Words: Hypothyroidism, Hyperthyroidism, Glycated haemoglobin (HbA1c), Triidothyronine (T3), Tetraidothyronine (T4), Thyroid stimulating hormone (TSH), Non-insulin dependent diabetes mellitus (NIDDM),
Worldwide diabetes mellitus (DM) is an important health issue affecting the significant population. The prevalence of the DM is increasing rapidly in both developing and developed countries1,2,3. India became like home to the massive number of people who have diabetes in any country. A recent study by the International Diabetes Federation (IDF) estimated that in India 40 million people are living with DM and the number predicted to grow to 70 million or more by 20202,3,4. DM and thyroid dysfunction are the most common endocrine disorders and mutually influenced each other5,6. Thyroid dysfunction shows its adverse effects on glycemic control in people with diabetes and shows the potential impact on health. Thyroid dysfunction commonly found in diabetics, particularly in type 2 DM7,8. The prevalence of thyroid dysfunction is higher among diabetic patients9,10,11. Hypothyroidism and hyperthyroidism are the major disorders of the thyroid gland. Worldwide, around 1.6 billion people in over 110 countries are suffering from thyroid dysfunction12,13,14. According to Wu P (2000), the diabetic population is having a higher prevalence of thyroid dysfunction than the healthy population15. Among thyroid disorders, hypothyroidism is most common disorder in the general population and more common among women and its prevalence increases with sex and age. Increased levels of Total cholesterol (TC) and Low-density lipoprotein (LDL) reported in hypothyroid patients which is a common cause of secondary dyslipidemia. Atherosclerosis and dyslipidemia related to cardiovascular disorders proved to associated with hypothyroidism9,16,17,18. We aimed to enhance knowledge gap of the interrelation between thyroid hormones, dyslipidemia, and diabetes. So the present study was aimed to assess the relationship between thyroid hormones and lipid profile in type 2 diabetic patients attending to a rural teaching hospital.
METHODS AND MATERIALS The present study was carried out at MNR Medical College and Hospital (600 beds teaching hospital catering to rural population) situated in Sangareddy, Telangana state. A total of 200 study subjects of both gender groups selected from the medicine ward, during the period from January 2016 to March 2017. This study approved by institutional ethical committee and investigations were carried out in the biochemistry laboratory, MNR Medical College and Hospital, Sangareddy. Inclusion Criteria
Exclusion Criteria All the patients with a history of thyroid disease, kidney, cardiovascular, and chronic liver disorders, drugs affecting the thyroid hormone levels, malignancy, pregnancy, patients with chronic illness and familial lipid disorders, lactation and type 1 DM excluded from the study. Collection of blood sample Blood samples were collected, after 12 hours fast from the above study subjects. 5ml of blood from the cubital vein collected in tubes containing sodium fluoride, EDTA, and bottle, after explaining the procedure to the study subjects. Serum was separated from the blood samples by a centrifuged machine at 3000 rpm for 10 minutes in the biochemistry department. Following estimations are carried out on the serum samples by standard kit methods, and analyses performed on ERBA-semi auto-analyzer. Parameters measured: In the present study following parameters were measured:
Plasma glucose estimated by using GOD-POD method2,3,19 and HbA1c estimated by using direct enzymatic assay method by using Ion exchange chromatography (Crest A Coral clinical system, USA).2,19. T3, T4, and TSH-estimated by using (CLIA -method) chemiluminescence immune assay method19,20. The Serum total cholesterol was measured by CHOD-PAP method2,3,19,20,21. Triglycerides measured by GPO-Trinder method2,3,19,20,21, HDL-Cholesterol measured by Phosphotungstic acid method2,3,19,20,21. and the values of Low-Density Lipoprotein cholesterol (LDL-C) and Very-low-density lipoprotein cholesterol (VLDL-C) can calculate by using Friedewald's equation2,3,11,12,19,20,21 as follows;
Reference range: The standard reference ranges according to the kits are as follows. FPG (normal range 70-110mg/dl), and HbA1c (normal range 4.2-6.2%). TSH (0.7-6.4 μIU/ml), T3 (0.52-1.85 ng/ml), T4 (4.0-11 μg/dl. Normal values for lipid profile parameters are total cholesterol (< 200 mg/dl), triglycerides (< 150mg/ dl), HDL-Cholesterol (30-60 mg/dl), LDL- Cholesterol (<100 mg/ dl), and VLDL-Cholesterol (20-40 mg/dl). Statistical Analysis: The collected data were analyzed by SPSS software version 16.0. All results presented as the mean ± standard deviation (SD). A p-value of less than 0.0001 (p< 0.0001) was considered significant.
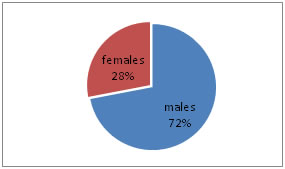
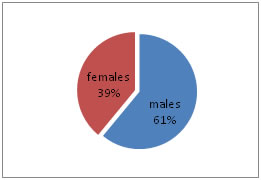
RESULTS In the present study, total 200 subjects divided into two groups, 100 controls (non-diabetic) and 100 cases (diabetic) with the age range of 30 – 70 years. Out of 100 non-diabetic controls, 61 were males and 39 females, and in 100 diabetic cases, 72 were males and 28 women as shown in the Table – 1, Figure - 1 and Figure – 2. The mean ± Standard deviation (SD) of FPG, HbA1c, T3, T4, and TSH in controls were in the range of 93.2 ± 9.78, 4.80 ± 0.19, 1.32 ± 0.29, 9.20 ± 1.79, and 2.17 ± 1.05, respectively. It observed that the mean ± SD of FPG, HbA1c, T3, T4, and TSH in cases were in the range of 174.93 ± 9.45, 7.66 ± 1.52, 0.77 ± 0.33, 6.94 ± 1.51, and 10.61 ± 3.15, respectively. It was evident that FPG, HbA1c, TSH levels increased in cases as compared to controls. The mean ± SD level of T3 and T4 was statistically significantly decreased in cases compared to controls (P<0.0001) as shown in Table - 2. The mean ± SD of TC, TG, HDL-C, LDL-C, and VLDL-C, in controls, were in the range of 177.48 ± 14.78, 126.92 ± 19.85, 45.12 ± 3.90, 106.97 ± 13.21, and 25.38 ± 3.97, respectively. It observed that the mean ± SD of TC, TG, HDL-C, LDL-C, and VLDL-C, in cases, were in the range of 236.0 ± 38.37, 229. 96 ± 55.82, 39.68 ± 2.74, 150.32 ± 34.44, and 45.99 ±11.16, respectively. It was evident that TC, TG, LDL-C, and VLDL-C levels increased in cases as compared to controls. The mean ± SD level of serum HDL was statistically significantly decreased in cases compared to healthy controls (P<0.0001) as per Table - 2.
Table 1: Gender and age wise distribution of cases and controls
Figure 1: Gender wise distribution of Cases
Figure 2: Gender wise distribution of Controls Table 2: Comparison of parameters between controls and cases
**S -extremely statistically significant. DISCUSSION Worldwide DM became a significant threat to the public health and also leading cause of mortality and morbidity. In daily clinical practice, type 2 DM and thyroid disorders are common endocrine disorders, and the underlying mechanism is not fully understood9. According to Jin T et, al.(2014), Duntas LH et, al.(2011) and Gurjeet S et, al.(2011), there is an association between thyroid disorders and diabetes with significant clinical implications22-24. Lipid metabolism actively regulated by thyroid hormones and dyslipidemia usually associated with thyroid dysfunction. In another hand type 2 DM is associated with abnormal lipid profile. Several reports assessed the relationship between lipid abnormalities and thyroid hormones; only a few studies evaluated this association in type 2 DM patients25-28. In the present study, increased serum levels of TC, TG, and LDL-C found in type 2 DM patients than controls. It might be due to low activity of lipoprotein lipase or the lipoprotein clearance. The present study revealed that serum levels of TSH significantly increased and the serum levels of T3, T4 have significantly decreased in type 2 DM when compared with normal healthy controls. Similar studies were reported by, Saeed W et al. (2016), Jiffri EH (2017), Demitrost L, et al., (2012), and Witting V et al. (2014) respectively.9,29,30,31. FBS and TSH levels were significantly increased in type 2 DM along with decreased levels of T3 and T4 than in non-diabetic controls. A similar study was reported by Anveetha et al.2015 respectively32. T3 and T4 levels decreased in diabetes due to, alterations in the hypothalamic-pituitary-thyroid axis that resulted in a reduction in the synthesis and release of thyroid releasing hormone (TRH). Which reduces the uptake of iodine by the thyroid gland that limits the production of T3 and T433,34. T3 and T4 levels were decreased and negatively correlated with TC, LDL-C, and TG. Among thyroid hormones especially, T3 is meant to regulate LDL receptors by binding to thyroid hormone responsive elements (TREs) and controlling sterol regulatory binding protein. Thyroid hormones especially, T3 and T4 are actively involved in the expression of 3-hydroxy-3-methyl-glutaryl-coenzyme A reductase (HMG-CoA), which is a NADPH dependent enzyme, initiate and enhance the cholesterol metabolism. Thus deficit thyroid hormones reduce the expression of LDL receptors and cholesterol synthesis in the liver. This lead to cellular uptake and catabolism of LDL from circulation. Finally increased levels of TC in the circulation35,36.
CONCLUSION In the current study, low levels of thyroid hormones positively associated with a dysregulation of lipid metabolism in patients with type 2 DM attending to a rural teaching hospital. Therefore we recommend continuous screening of thyroid hormones is suggested in type 2 DM to reduce the risk of thyroid hormone dysfunctions and vascular complications and also helps in the management of diabetes.
REFERENCE
|
|||||||||||||||||||||||||||||||||||||||||||||||||||||||||||||||||||||||||||||||||||||||||||||
 This work is licensed under a Creative Commons Attribution-NonCommercial 4.0 International License.