 Home
HomeOfficial Journals By StatPerson Publication
|
Table of Content - Volume 5 Issue 3 - March 2018
Serum adenosine deaminase levels in patients with type 2 diabetes mellitus and its relation with fasting blood glucose and glycated hemoglobin levels
P Kiranmai
Associate Professor, Department of Biochemistry, Osmania Medical College and Hospital Hyderabad, Telangana, INDIA. Email: drkiranmai_23@yahoo.co.in
Abstract Background: Insulin resistance and decreased insulin secretion are the main physiological abnormalities of Type 2 Diabetes Mellitus (DM). Cell mediated immune system disturbance and improper T lymphocyte function also contribute to the pathophysiology of Type2 DM. Chronic hyperglycemia leads to increased oxidative stress and increases Adenosine deaminase(ADA) levels, Both these lead to insulin resistance. As there is relationship between cell mediated immunity, ADA and Type 2 DM, the present study was undertaken to determine S.ADA levels in Type 2 DM and highlight its importance in the immunopathogenesis of Type 2 DM. The study also aims to find correlation between S. ADA and Fasting Blood Sugar (FBS), Glycated hemoglobin (HbA1c). Materials and Methods: 100 individuals in the age group 35 to 65 yrs of established Type 2 DM were included in the study group. Study group is further divided into 2 groups Group I includes 50 Diabetics with HbA1c <7 % and Group II includes 50 Diabetics with HbA1C >7 %. A group of 50 Normal healthy age matched individuals served as the control group. In both groups FBS, S.ADA and HbA1C are measured and compared using Student T test and pearsons correlation statistics. Results: The study showed that FBS, S.ADA and HbA1c levels were significantly higher in group I and Group II when compared to control group. Comparison between group I (well controlled Diabetes patients) and Group II (poorly controlled Diabetes Patients) showed significantly increased ADA activity (p<0.001). There was positive correlation between ADA and HbA1c in groups I and II (p< 0.01 and p<0.001 respectively) Conclusions: Increased S.ADA activity may be an important indicator of immunopathogenesis of Type 2 DM and hence can serve as a marker for diagnosis of DM. Positive Correlation between S.ADA and HbA1c suggests that S. ADA levels can be used for assessing the short term and long term Glycemic status in Type 2 Diabetes Mellitus. Key Words: Type 2 Diabetes Mellitus, Adenosine Deaminase, Fasting Blood Glucose, Glycated haemoglobin.
Diabetes Mellitus (DM) is the most important causative factor of mortality in the developing countries affecting more than 170 million persons all over the world.1 The incidence and prevalence of Type 2 DM are globally increasing according to a study by WHO with prevalence in countries like India and China estimated to cross 228 million2,3 DM is characterised by Insulin deficiency either in action or secretion associated with hyperglycemia and disturbances of carbohydrate, lipid and protein metabolism4. Hyperglycemia causes longterm dysfunction and failure of organs like eyes, kidneys, heart, nerves, and blood vessels.5 Insulin resistance and decreased insulin secretion are the main physiological abnormalities of Type 2 DM6 Cell mediated immune system disturbance and improper T lymphocyte function also contribute to the pathophysiology of Type2 DM.7 Adenosine Deaminase (ADA)catalyses the deamination of adenosine to inosine and 2’ deoxy adenosine8. ADA is considered as a good marker of cell mediated immunity9. It has a crucial role in lymphocyte proliferation and differentiation10. ADA has been reported to be a marker for insulin function11,12. But its relation with the immune system in diabetic subjects is not established. Some studies reported elevated ADA activity in Type 2 DM (12) and some studies were inconclusive13. Adenosine formed by the activity of ADA increases the glucose uptake inside the cells. Thus, high ADA activity decreases adenosine levels and this decreases glucose uptake into cells14. Chronic hyperglycemia leads to increased oxidative stress by forming enediol radicals and superoxide ions by NADPH Oxidase system and increases ADA levels, Both these lead to insulin resistance.9 As there is relationship between cell mediated immunity, ADA and Type 2 DM, the present study was undertaken to determine S.ADA levels in Type 2 DM and highlight its importance in the immunopathogenesis of Type 2 DM. The study also aims to find correlation between S. ADA and Fasting Blood Sugar (FBS), Glycated hemoglobin (HbA1c).
Hundred (100) individuals of established Type 2 DM attending the OPD of Medicine department of Gandhi Hospital were included in the study group. Inclusion Criteria
Exclusion Criteria
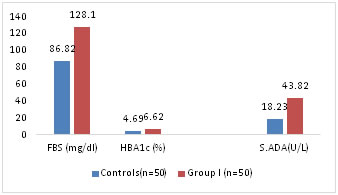
Study group is further divided into 2 groups with relation to HbA1c. Group Ia includes 50 Diabetics with HbA1c <7 % and Group Ib includes 50 individuals with HbA1C >7 %. A group of 50 Normal healthy individuals in the age group 35 to 65 yrs served as the control group. After due consent fasting venous blood 5 ml is collected from both study and control group individuals and following parameters are estimated. FBS is estimated by GOD POD Method. HbA1C by Mispa-I nephelometer (15). ADA levels were estimated using erba kit16. The assay is based on the enzymatic deamination of adenosine to inosine which is converted to hypoxanthine by purine nucleoside phosphorylase (PNP). Hypoxanthine is then converted to uric acid and H2O2 by xanthine oxidase. Hydrogen peroxide is further reacted with N-Ethyl N-2 -Hydroxy 3 sulf- opropyl -3 methyl aniline (EHSPT) and 4 aminoantipyrine in the presence of peroxidise to generate Quinine dye which is monitored at 546 nm. One unit of ADA is defined as the amount of ADA that generates one micromole of inosine from adenosine per min at 370 c. Statistical Analysis: Was performed by SSPS Software. Analysis was done by student t test. All variables were expressed as mean +SD. To find out the correlation between two variables Pearsons correlation coefficient was used. A p value of <0.05 was considered as statistically significant. RESULTS Diabetics attending OPD of Medicine department were screened by measuring HbA1c to get a study population of 50 Diabetics with <7% HbA1c and 50 individuals with >7%cHbA1c. The study group is divided into 2 groups, group I (n=50) with HbA1C < 7% and into Group II (n=50) HbA1c > 7 %. FBS and S.ADA levels are measured in both control and study groups. Mean age of control group was 52+3.25 yrs and mean age of study population Group I is 53+8.50 yrs and Group II is 56+12.15 yrs. Mean FBS among all groups is compared. Mean FBS in control group is 86 +4.21 which is less than mean FBS in Group I (N= 50) 128.1+11.2 (p<0.05) Table-1, fig-1.
Table 1: Comparison of FBS, HBA1c and S.ADA between control group and Study group I
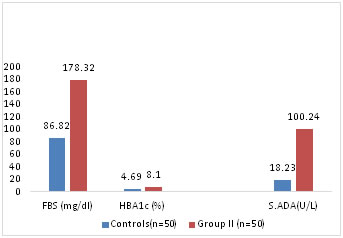
The increase in FBS in Group II when compared to control group is more significant (p<0.001) than increase of FBS in Group I compared to control (p< 0.05) Table2.Fig-2
Table 2: Comparison of FBS, HbA1c and S.ADA levels between control group and study group II
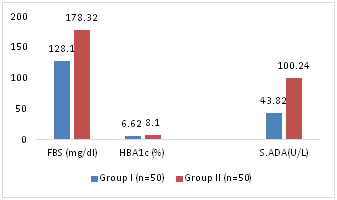
Figure 2: Comparison of Mean FBS, HbA1c and S.ADA levels between Control and Study Group II S.ADA levels are compared among the 3 Groups. S. ADA mean values in Group I and Group II are 43.82+16.12 and 100.24+13.2 respectively. Statistically Mean S.ADA in Group I is more than in control Group (p<0.001) Table1. Mean S.ADA in group II is more than in control group (p<0.0001). Table 2 Mean S.ADA is compared between Group I and Group II show a significantly high S.ADA levels in Group II (p<0.001) showing a significant difference between FBS and Mean ADA levels between subjects with poor glycemic control (HbA1c > 7%) than subjects with good glycemic control (HbA1c<7%) Table3, Fig 3 Table 3: Comparison of FBS, HbA1c and S.ADA levels between Group I and Group II
Figure 3: Comparison of Mean FBS, HbA1c and S.ADA LEVELS between Study Group I and Study Group II
It is observed that the mean HbA1c levels in control Group is 4.69+0.62 and that in Group I is 6.62+0.3 and in Group II is 8.1+1.2. There is significant difference in levels of HbA1c between control group and Group I (p<0.01) and Group II (p <0.001). Table1,2,3 Correlation coefficient showing the relationship between S.ADA, FBS and HbA1c showed positive correlation between S.ADA and FBS in Group I and Group II but there was no significant correlation between S.ADA, FBS and HBA1c in control group. Positive correlation between S.ADA and HBA1c is more significant in group II (p<0.001) than in Group I (p< 0.01). Table-4
Table 4: Pearsons Correlation and significance between S.ADA and FBS, HbA1C in control and study groups
DISCUSSION In our study the Mean S.ADA levels are significantly higher in Group I and Group II when compared to controls (p<0.01 and p< 0.001 respectively). S. ADA levels when compared between Group I and Group II also showed significant higher levels in Group II than in Group I (p<0.01). This is in accordance with previous studies, Kurtal et al11 and Kaur et al17. Recent Studies showed that in type 2 DM, disturbed immune responses may result from the defects in insulin action which is required for T-Lymphocyte function18. ADA plays an important role in lymphocyte proliferation and differentiation10. The high S.ADA activity observed in our study in type 2 DM may be due to altered insulin related T-Lymphocyte function9. Adenosine plays a role in mediating insulin action of glucose uptake in skeletal muscle and so high ADA activity decreases glucose uptake into cells and contributes to insulin resistance19. Previous studies concluded that the increase in adenosine content has similar effect to insulin on glucose and lipid metabolism in adipose tissue20, 7. The increase in S.ADA levels in our study may be due to insulin resistance or increased secretion of Adenosine21. Increase in S.ADA levels in Type 2 DM may be explained by extracellular cAMP Adenosine pathway. ADA excess activity inactivates adenosine and enhance lipolysis. This leads to increase in cAMP. Deficiency of insulin in case of Type 2 DM leads to increase in free fatty acids and glucose in circulation which are taken up by Liver and adipose tissue. This causes steatohepatitis, adipocyte hypertrophy and insulin resistance22,23. Hyperglycemia leads to increased oxidative stress by formis with NADPH oxidase system and increases ADA levels both leading to insulin resistance. Adenosine absence causes down regulation of GLUT 4 receptors which may be another cause for insulin resistance.24. In our study a positive correlation has been observed between HbA1c and ADA indicating S.ADA level as a marker for short and long term glycemic control and its role in glucose and lipid metabolic derangements seen in type 2 DM patients. This is in accordance with the previous studies Kurtul et al19, Ramani et al25.
CONCLUSIONS Increased S.ADA activity may be an important indicator of immunopathogenesis of Type 2 DM and hence can serve as a marker for diagnosis of DM. Positive Correlation between S.ADA and HbA1c suggests that SADA levels can be used for assessing the shortterm and long term Glycemic status in Type 2 Diabetes Mellitus.
REFERENCES
|
|||||||||||||||||||||||||||||||||||||||||||||||||||||||||||||||||||||||||||||||
 This work is licensed under a Creative Commons Attribution-NonCommercial 4.0 International License.