 Home
HomeOfficial Journals By StatPerson Publication
|
Table of Content - Volume 8 Issue 3 - December 2018
Insulin resistance is associated with increased IRS-1 serine phosphorylation in fat fed rats
R Vinayagamoorthi1, C Selvakumar2*, Zachariah Bobby3
1Department of Biochemistry, Indira Gandhi Medical College and Research Institute (IGMC and RI), Puducherry, INDIA. 2Associate Professor, Department of Biochemistry, ESI Hospital and Postgraduate Institute of Medical Sciences and Research, Manicktala, Kolkata, INDIA. 3Department of Biochemistry, Jawaharlal Institute of Postgraduate Medical Education and Research (JIPMER), Puducherry, INDIA. Email: drselvakumarc@yahoo.com
Abstract Insulin resistance is an important factor in the pathogenesis of type 2 diabetes. Increased intake of dietary fat induces insulin resistance in both humans and experimental animals. The molecular basis that leads to high fat diet induced insulin resistance are not clearly identified. In the present study, we fed the control group rats with rodent chow and experimental group rats with a high fat diet for the period of nine weeks. Nine weeks of fat feeding to the rats induced insulin resistance when compared to the chow diet fed control rats. Insulin signaling study in skeletal muscle of fat fed rats showed normal insulin stimulated tyrosine phosphorylation of insulin receptor. But we found a significant increase in the serine phosphorylation of IRS-1 and a decreased insulin stimulated tyrosine phosphorylation of IRS-1 in the high fat fed rats compared to the control rats. These results indicates, increased serine phosphorylation of IRS-1 decreases the insulin stimulated IRS-1 tyrosine phosphorylation and leads to insulin resistance in fat fed rats. The association of increased IRS-1 serine phosphorylation with insulin resistance may help us in the understanding of mechanisms of insulin resistance in obesity/dyslipidemia induced diabetes and provide new therapeutic targets for the management of type 2 diabetes. Key Word: Insulin resistance, High fat diet, Insulin receptor, Insulin receptor substrate-1 (IRS-1), Tyrosine / Serine phosphorylation.
INTRODUCTION Type 2 diabetes mellitus is a prevalent cause of morbidity and mortality, mainly through its chronic complications includingrenal failure and cardiovascular complications. Despite decades of intensive investigation, its pathogenesis remains incompletely understood. Insulin resistance is the primary factor of type 2 diabetes and involved in the pathogenesis of hypertension, hyperlipidemia and polycystic ovarian disease1. Insulin resistance occurs when higher concentrations of insulin requires to regulate body glucose homeostasis. Insulin regulates glucose homeostasis mainly by increasing the transport of glucose into the skeletal muscle. Binding of insulin to the extracellular domine of insulin receptor activates the tyrosine kinase activity of intracellular domine and their by phosphorylates the tyrosine residues of insulin receptor substrate-1 (IRS-1). Activation of IRS-1 molecules by tyrosine phosphorylation, promotes the entry of glucose in to muscle and fat cells by the translocation of intracellular glucose transporter GLUT4 isoforms to the cell surface via phosphatidyl inositol 3 kinase (PI3K) activation2. Insulin resistance in humans can result from inherited factors or develop through life-style and environmental effectors3,4. Obesity is a primary contributor to acquired insulin resistance, as increasing adiposity is correlated with impaired insulin action5. Numerous studies have documented the development of insulin resistance as a result of increased intake of dietary fats. High fat diet feeding to rodents leads to insulin resistance6,9. The high fat diet-fed rodent is of interest of research model because it might provide insights regarding the mechanisms underlying insulin resistance in individual with obesity and impaired glucose tolerance. Numerous insulin signaling defects have been reported in rats fed with high fat diet. Previous studies in fat fed rats demonstrated decreased insulin stimulated PI3K activity and GLUT4 translocation10. This suggests that defects in the proximal insulin signaling pathway as a result of increased fat intake. Although there are evidence for high fat diet induced defects in insulin signaling pathway, these studies produced contradictory reports. Studies have shown reduced insulin receptor and its decreased intrinsic tyrosine kinase activity in high fat fed rats11,12.But others have shown normal insulin receptor levels and its function in fat fed rats13.There are reports described decreased IRS-1 levels, reduced insulin stimulated IRS-1 tyrosine phosphorylation in high fat fed rats14. In vitro and in vivo studies are linking insulin resistance with increased serine phosphorylation of insulin receptor and IRS-115.Thus insulin signaling defects responsible for high fat induced insulin resistance is not clearly understood. Hence, the present study was attempted to explore the components of proximal insulin signaling pathway in high fat fed rats, which closely mimics theobesity/dyslipidemia mediated insulin resistance in humans.
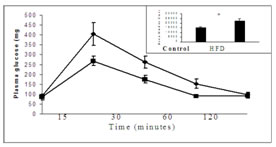
MATERIALS AND METHODSMaterials: Insulin receptor b-subunit, IRS–1, phospho tyrosine antibodies were purchased from Cell Signaling Technology. Phospho serine antibody was obtained from Santa Curz Biotechnology. Protein-Aagarose slurry was purchased from Bangaloregenei, India. Insulin (human recombinant) and all other chemicals were purchased from Sigma Chemicals.Treatment of Animals: Male Wistar rats weighing 150-200 gms at the beginning were used for this study. All experimental procedures were approved by the Institute Animal Experimentation Ethics Committee. Rats were randomly assigned to either high fat diet or chow diet groups. The semi- purified high fat diet was prepared as described previously 16, with 59% of total calories derived from fat, 21% from protein and 20% from carbohydrate. The energy of the high fat diet was 5.2 Kcal/g, where as that of the chow diet was 3.3 Kcal/g. The rats were provided diet and water ad libitum for 9 weeks.Intraperitonial glucose tolerance test: Intra peritoneal glucose tolerance test was performed as described previously16. Animals were injected intraperitonealy with glucose (2.0 g/kg body weight) after an overnight fasting. Blood samples were taken at different time points to estimate plasma glucose. Area under curve was calculated from the graph using NCSS12 software.Insulin stimulation: Insulin stimulation was performed at the end of 9th week by injecting 15 units/kg of insulin intraperitonially13. After insulin stimulation, a 30 minutes interval was given for maximum insulin effect. After 30 minutes, the animals were sacrificed and hind muscle was removed and stored at -700C for insulin signaling analysis by immunobloting. Preparation of muscle homogenate and western blotting: Proteins were extracted from the frozen muscle using homogenizationbuffer (50 mMTris-Hcl pH 7.4, 1% Nonidet P-40, 0.25% sodium deoxycholate, 150 mMNacl, 1mM sodium vandate, 1mM phenyl methyl sulfunyl fluoride, 1mMaprotinin, 1mM leupeptin, 0.5 mg/ml okadaic acid ) as described previously17. Homogenates were centrifuged at 40C at 12,000g for 15 minutes, supernatant collected and protein content was estimated by the method of Bradford18.100 mg of protein were resolved by 8.0 % SDS polyacrylamide gel electrophoresis, electrotransfered onto nitrocellulose membrane, and immunobloted for insulin receptor and IRS-1 with specific antibodies. Protein bands were visualized by enhanced chemilluminance method using Amersham ECL–kit. Bands were scanned using Biorad densitometer (GS-710) and quantified by Biorad Quantity 1 software. Immunoprecipitation: Muscle homogenate (250mg) was incubated overnight at 40C with antibodies specific to insulin receptor and IRS-1, and the immune complexes were captured by adding 50ml of protein A-agarose beads and incubated for 2 hours at 40C. Immune complexes were pelleted at 12,000g for 15 minutes at 40C and washed three times with homogenization buffer, suspended in Laemmli samplebuffer19, boiled for 5 minutes, resolved by 8.0 % SDS polyacrylamide gel electrophoresis, electrotransfered onto nitrocellulose membrane. Proteins were immunobloted with phosphoryted specific tyrosine antibody and immunoblot was stripped of bound antibodies and then reprobed with phosphorylated specific serine antibodies. Protein band detection and quantification were performed as mentioned above. Statistical Analysis: Data are expressed as mean + S.E. Analysis of difference between the high fat fed and chow fed control groups was performed using a student’s t test. One way ANOVA was performed with Tukey post hoc test for the comparison of more than one group. A ‘P’ value less than 0.05 was considered as statistically significant.RESULTS Figure 1: Effect of high fat diet on glucose tolerance Fig.1. Effect of high fat diet on glucose tolerance in male Wistar rats. After 9 weeks of fat feeding glucose tolerance test was performed in overnight fasted rats by intraperitonial injection of glucose (2g/kg). Area under the curve (AUC) was calculated using NCSS12 software. Values are expressed as mean + S.E. * P<0.01 vs control. HFD = High fat diet. Area of the curve significantly (P<0.01) increased in fed fat rats compared to chow diet fed rats. This indicates that 9 weeks of fat feeding causes glucose intolerance to the rats.
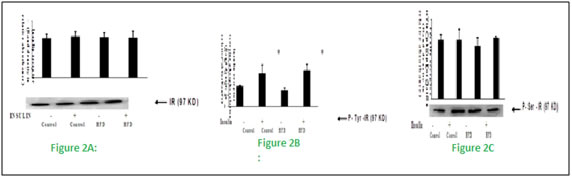 Figure 2: Effect of high fat diet on insulin receptor
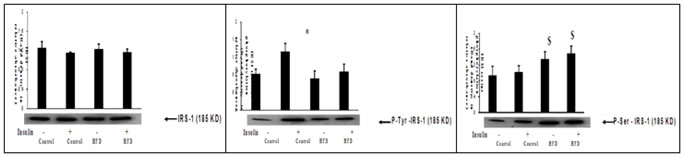
Male Wistar rats were fed with either high fat or rodent chow diet for nine weeks. At the end of 9th week, hind limb muscle was removed and homogenate was prepared. Western blotting and immunoprecipitation analysis were performed in the muscle homogenate as described in methods. Fig 2 (A), Western blotting analysis of insulin receptor content. Fig 2 (B), Immunoprecipitation and immunoblotting analysis of insulin receptor tyrosine phosphorylation. Fig 2 (C), Immunoprecipitation and immunoblotting analysis of insulin receptor serine phosphorylation. A representative immunoblot of four independent experiments is shown. Results shown are mean + SE of four experiments. (-) and (+) indicates the basal and after insulin stimulation. *P < 0.001 compared to basal. HFD = High fat diet.These results indicates that fat feeding did not affect the insulin receptor concentration and its tyrosine kinase activity. Figure 3: Effect of high fat diet on insulin receptor substrate Figure 3: Effect of high fat feeding on IRS-1. Male Wistar rats were fed with either high fat or rodent chow diet for nine weeks. At the end of 9th week, hind limb muscle was removed and homogenate was prepared. Western blotting and immunoprecipitation analysis were performed in the muscle homogenate as described in methods. Figure 3(A), Western blotting analysis of IRS-1 content. Figure 3(B), Immunoprecipitation and immunoblotting analysis of IRS-1 tyrosine phosphorylation. Figure 3(C), Immunoprecipitation and immunoblotting analysis of IRS-1 serine phosphorylation. A representative immunoblot of four independent experiments is shown. Results shown are mean + SE of four experiments. (-) and (+) indicates the basal and after insulin stimulation.*P <0.001 compared to basal. $ P < 0.001 compared respective control. HFD = High fat diet. Fat feeding had no effect on IRS-1 content (Fig 3.A). However, we found a significant (P < 0.01) reduction in the insulin stimulated IRS-1 tyrosine phosphorylation in fat fed rats when compared to control rats (fig 3.B).When compared to chow fed control rats, high fat feeding significantly(P<0.01)increased the serine phosphorylation of IRS-1(Fig 3.C).This advocates that impaired insulin stimulated IRS-1 tyrosine phosphorylation in high fed animals is associated with the increased IRS-1 serine phosphorylation.
DISCUSSION In the present study, we examined the insulin resistance and insulin signaling pathway in fat fed rats, which closely resembles the dyslipidemia induced diabetes in humans. Fat feeding for 9 weeks decreased the glucose tolerance ability of rats, reduced the insulin stimulated IRS-1 tyrosine phosphorylation and increased IRS-1 serine phosphorylation compared to chow fed control rats. The molecular basis for the high fat diet induced insulin resistance is not known. There are reports that increased dietary fat increases NADH and citrate, leading to the inhibition of hexokinase activity and glucose uptake20. Youngren et al13 reported a decreased insulin receptor and IRS-1 content in the skeletal muscle of fat fed rats. But we did not find any significant change in insulin receptor and IRS-1 concentration compared to control animals. However in agreement with previous reports21, we found a reduced insulin stimulated IRS-1 tyrosine phosphorylation. This difference in the results of studies can be explained by the differences in the study design like type of fat diet (corn oil, sunflower oil, lard, beef tallow etc.) and the period of diet given to the animals. In the present study, the rats were fed with sunflower oil as fat source for a short duration (9 weeks) to identify the defects in the proximal insulin signaling pathway. In the present study feeding of rats with sunflower oil as fat source for 9 weeks induced insulin resistance and impaired the insulin stimulated IRS-1 tyrosine phosphorylation, which is associated with the increased IRS-1 serine phosphorylation. Number of possible mechanisms could be responsible for the increased IRS-1 serine phosphorylation induced insulin resistance. Serine phosphorylation of IRS-1 inhibits its association with the insulin receptor and impairs the insulin stimulated IRS-1tyrosine phosphorylation22. Otherwise serine phosphorylated IRS-1 impairs interaction with insulin receptor due to the involvement of unknown signaling molecules that sterically hamper the association of insulin receptor and IRS-123. Many agents such as okadaic acid, TNF-a, angiotensin II, hyperinsulinemia and platelet-derived growth factors all increase IRS-1 phospho- serine content. Most of these agents including TNF-a are the activators of serine/threonine kinases, while others are inhibitors of ser/thr phosphatases. Researchers are interested in the identification of the serine kinases that mediate the serine phosphorylation of IRS-1. It is however, a difficult task because IRS-1 contains more than 30 potential serine phosphorylation sites. These serine residues are potential targets for various kinase, including C-Jun–N-terminal kinase (JNK), PKA, inhibitory kappa kinase (IKK) and PKB. It was reported that serine phosphorylation of IRS-1 at ser612 inhibits the interaction of IRS-1 with insulin receptor and decreases the insulin stimulated IRS-1 tyrosine phosphorylation24. Evidences suggest that phosphorylation of ser307in IRS-1 due to the activation of JNK and IKK inhibits insulin signaling13,25,26. In fat fed rats, inhibition of IKK activity improves insulin action 27. At this junction, it is clear that different serine residues of IRS-1may get phosphorylated by diverse serine kinases. In the present study, in what way the high fat diet increases IRS-1 serine phosphorylation is not known. A conceivable description for high fat induced IRS-1 serine phosphorylation might be due the activation of serine kinase(s) which increase the IRS-1 serine phosphorylation.
CONCLUSION Our results shows increased IRS-1 serine phosphorylation and decreased insulin stimulated IRS-1 tyrosine phosphorylation as early defect in insulin signaling in fat fed rats. Further studies which discover the molecular mechanism(s) of increased IRS-1 serine phosphorylation in fat fed rats might help us to understand the mechanisms involved in insulin resistance and guide to the identifications of newpharmaceutical targets to obesity/ dyslipidemia induced insulin resistance.
REFERENCES
|
 This work is licensed under a Creative Commons Attribution-NonCommercial 4.0 International License.