 Home
Home
|
Table of Content Volume 16 Issue 1 - October 2020
Correlation between glycaemic control and lipid profile in type 2 diabetes mellitus patients
Rahul Y. Netragaonkar1, Amrut A. Swami2*, Anand R. Bhide3
1Associate Professor, 2Assistant Professor, Department of Community Medicine, DVVPF’s Medical College Ahmednagar, Maharashtra. 3Assistant Professor, Department of Community Medicine, Rural Medical College, PIMS, Loni, Maharashtra. Email: rahulnetra@gmail.com , draaswami@gmail.com , dranandrbhide@gmail.com
Abstract Background: Patients with type 2 diabetes have increased prevalence of the dyslipidemia. A timely intervention to normalize these circulating lipids might reduce chances of the cardiovascular diseases. Glycated Hb (HbA1c) is an indicator of glycemic status over long term. This study was conducted to find the association between glycemic control and lipid profile in patients with type 2 DM. In developing countries like India, fast industrialization and modern lifestyle is causing more number of DM patients daily. Type 2 diabetes mellitus is often associated with abnormalities of lipids which give rise to the increased incidence of micro vascular and macro vascular complications. We evaluated total 100 diabetic patients with type 2 DM visiting our department in a tertiary care hospital and medical college. HbA1c levels were used for classification of patients into good (< 6.5) and poor (≥ 6.5) glycaemic control and for comparing different lipid profile parameters in our study. There was significant association between the age and HbA1c levels (p < 0.05). There was significant association between the duration of diabetes and HbA1c levels (p < 0.05). Mean HbA1c level in study population was 8.42 ± 1.23, showing overall poor glycaemic control in our study population, similarly the mean levels of lipids show a deranged pattern. Very strong correlation was seen between FBS levels and HbA1c (p<0.0001). Positive correlation was seen between HbA1c levels and Total Cholesterol, LDL and VLDL while negative correlation was seen between HbA1c and HDL levels. The study concludes that to maintain good lipid profile and prevent further cardiovascular complications, better sugar control is required. Key Words: Type 2 Diabetes Mellitus, Lipid Profile, Sugar Control, HbA1c
INTRODUCTION Diabetes Mellitus is a group of common disorders that share the phenotype of hyperglycemia.1. India is also experiencing an endemic of Diabetes mellitus. In India dietary and lifestyle changes is causing more number of DM patients daily, which is estimated to reach 80 million by year 20302. Diabetes mellitus is characterized by rise in blood sugar levels and subsequent lethal patho-physiological changes in the body. Diabetes is classified into two types, type 1 and type 2. Type 2 diabetes is more prevalent and occurs either when the β-cells of pancreas do not produce enough insulin. Type 2 diabetes mellitus is often associated with abnormalities of lipids which give rise to the increased incidence of vascular complications3. HbA1c is routinely used everywhere as a diagnostic tool for measuring long term glycemic control, it tells us about average blood sugar levels over the period of past few months. HbA1c also is a predictor of the risk for the complications in diabetes patients. Good glycemic control with the evidence of decreased level of the HbA1c is likely to reduce the risk of DM related complications4. For each 1% increase in HbA1c value in DM patients, the estimated risk of Cardio Vascular Diseases (CVD) has been shown to be increased by almost 18% 5. Also in nondiabetic cases with HbA1c levels within the normal range, positive relationship has been demonstrated between HbA1c and CVD6,7. Lipid profile abnormality present in type 2 diabetes mellitus patients is shown by abnormal high level of triglycerides (TG), low density lipoprotein (LDL-C), very Low density lipoprotein (VLDL-C) and the low levels of high density lipoprotein (HDL-C)8-9. Altered lipid profile, especially high LDL-C, is very common in diabetes mellitus and it is strongly associated with poor glycemic control. Glycated haemoglobin (HbA1c) is the main tool for measuring long term glycemic control10. Many factors are responsible for diabetic dyslipedemia, these are: effect of insulin on liver Apoprotein productions, regulation of lipoprotein lipase (LpL), actions of cholesteryl ester transfer protein, and action of insulin on adipose and muscle tissues 11,12. Dyslipidemia, especially high LDL-C, is common in diabetes mellitus and strongly associated with poor glycemic control. Glycated hemoglobin (HbA1c) is main routinely used tool for measuring long term glycemic control13. HbA1c is a main indicator for mean blood glucose level; HbA1c predicts the risk of diabetic complications in diabetic patients.13 HbA1c is the main indicator for mean blood glucose level; HbA1c predicts the risk of diabetic complications.14 This study was conducted to find the association between glycemic control and lipid profile in patients with type 2 DM.
MATERIALS AND METHODS Study Type: Cross Sectional Study Study Population: All patients diagnosed with Type 2 Diabetes Mellitus, either visiting the OPD or admitted in the Hospital. Study Duration: Two years, January 2018 till December 2019. Sample Size: A total of 100 patients were included in the study. Methods: Complete history taking and clinical examination of all the patients was done, they were investigated for the fasting blood glucose level, HbA1c and Lipid Profile. Data was entered in Microsoft Excel and was analysed with Epi Info version 7.2.1. Ethical Clearance: Ethical clearance was obtained from the institutional ethics committee. All the patients signed a written informed consent before participating in the study. Inclusion Criteria:
Exclusion Criteria:
RESULTS AND DISCUSSION We studied 100 cases of type 2 DM visiting the Hospital. The cases were classified according to the glycemic control by HbA1C levels using the cut off 6.5 with HbA1C < 6.5 considered as good control while HbA1C ≥ 6.5 as poor Glycaemic control. 16 out of total 100 patients (16%) had good glycemic control (HbA1C < 6.5), while the rest 84 patients (84%) had poor glycaemic control (HbA1C ≥ 6.5).
Table 1: Age categories and HbA1c levels
When we categorised patients according to the age groups of less than 40 years (14%), 40 to 60 years (52%) and more than 60 years (34%), maximum number of patients (52%) were from the age group of 40 to 60 years. There was significant association between age and HbA1c levels. (p= 0.0026)
Table 2: Duration of Diabetes and Glycemic control
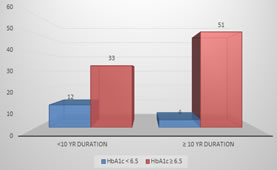
Out of total 100 patients, 45% patients had diabetes for less than 10 years while rest of the 55% patients had the disease for more than 10 years. There was significant association between the duration of diabetes and HbA1c levels. (p= 0.0085)
Figure 1: Duration of Diabetes and Sugar Control The mean levels of the tests including HbA1C, Fasting Blood Glucose, Total Cholesterol, Triglycerides, LDL, VLDL and HDL are as follows-
Table 3: Mean and Standard Deviation values for different study parameters.
The mean HbA1C levels in our study population was 8.42 ± 1.23, which shows the mean glycaemic control on a poor side. (HbA1C >6.5). The Mean FBS level observed in our study population was 184.42 ± 57.0 mg/dl. The means of total cholesterol levels in our study population was 164.13 ± 43.25 mg/dl, triglycerides level was 164.13 ± 43.25 mg/dl while the mean LDL, VLDL and HDL levels were 95.91 ± 26.54 mg/dl, 45.87 ± 26.17 mg/dl and 46.52 ± 19.50 mg/dl respectively. The overall mean levels of lipid profile in the study population shows that the lipid profile is deranged with levels more than the expected normal values for our patients.
Table 4: Comparison between different study parameters and HbA1C levels.
As seen in table 4, significant correlation was observed in our study between different parameters and HbA1C levels. Very strong correlation was seen between FBS levels and HbA1C levels (p<0.0001). Indicating mean FBS levels on lower side in the patients with good Glycaemic control (HbA1C < 6.5). Significant positive correlation was observed between HbA1C levels, total cholesterol (p= <0.0001) and LDL (p= <0.0001), VLDL (p= 0.0021) and negative correlation with HDL (p = 0.001).There was no correlation between triglycerides levels.
DISCUSSION Lipid abnormalities are very common in DM patients and they are frequently seen in patients with deranged blood sugars in type-2 diabetic mellitus. The abnormal lipid profile observed in type 2 DM is said to be related to the insulin resistance as reported in many previous studies, which leads to the increased release of free fatty acids from fatty tissues, impaired muscle uptake of free fatty acids and an increased fatty acid release to the liver14 which has been closely associated with the diabetic dyslipedemia and hypertension15. Enormous risk to cardiovascular diseases is observed. Chronic hyperglycemia causes glycation of apolipoproteins and interferes with the normal pathways of lipoprotein metabolism16. We studied 100 cases of type 2 DM visiting the Hospital. The cases were classified according to the glycemic control by HbA1C levels using the cut off 6.5 with HbA1C < 6.5 considered as good control while HbA1C ≥ 6.5 as poor Glycaemic control. 16 out of total 100 patients (16%) had good glycemic control (HbA1C < 6.5), while the rest 84 patients (84%) had poor glycaemic control (HbA1C ≥ 6.5). Many recent studies have shown a similar percentage of patients (14 – 19%) having poor glycemic control amongst diabetic patients.17-20 When we categorised patients according to the age groups of less than 40 years (14%), 40 to 60 years (52%) and more than 60 years (34%), maximum number of patients (52%) were from the age group of 40 to 60 years. There was significant association between age and HbA1c levels. (p= 0.026) In a similar study by G. Ramona et al. [13], they found that as the age advances the glycemic control of the patients worsens, these findings are similar to our study. Out of total 100 patients, 45% patients had diabetes for less than 10 years while rest of the 55% patients had the disease for more than 10 years. There was significant association between the duration of diabetes and HbA1c levels. (p= 0.0085) N Vaish et al.16 observed patients having diabetes more than 10 years had mean HbA1c of 9.62 ± 4.2 compared to those having diabetes of less than 10 years with HbA1c of 6.42 ± 2.1. Their study suggested that patients with more duration of diabetes showed deranged sugar control as in our study. They recommended strict glycemic control to avoid cardiovascular complications. The overall mean levels of lipid profile in the study population shows that the lipid profile is deranged with levels more than the expected normal values for our patients. The mean HbA1C levels in our study population was 8.42 ± 1.23, which shows the mean glycaemic control on a poor side. (HbA1C >6.5). Many studies have reported the deranged lipid profile in patients of type 2 DM.16 – 19 Very strong correlation was seen between FBS levels and HbA1C levels (p<0.0001). Indicating mean FBS levels on lower side in the patients with good Glycaemic control (HbA1C < 6.5). Significant positive correlation was observed between HbA1C levels, total cholesterol (p= <0.0001) and LDL (p= <0.0001), VLDL (p= 0.0021) and negative correlation with HDL (p = 0.001).There was no correlation between triglycerides levels. A Begum et al. [18] reported similar findings with strong correlation between the sugar control and lipid profile parameters. They noted that there was a strong correlation between the FBS levels and HbA1C levels (p<0.05), lipid parameters and HbA1c levels (p < 0.05). IM Artha et al. [19] and P Satyanarayana [20] also showed similar findings.
CONCLUSION Significant association between the age, duration of diabetes and sugar control in the form of HbA1c levels was seen in our study results. A positive correlation between the HbA1c and dyslipidaemia was seen in our study results. Similar positive correlation of HbA1c level was also seen in previous studies11. HbA1c showed positive correlations with LDL and VLDL and negative correlations was found between HbA1c and HDL levels. Very strong positive correlation was seen between FBS levels and HbA1C levels in our study population. Thus our study concludes that good sugar control is necessary in diabetic patients to maintain good lipid profile and avoiding any further atherogenic complications from dyslipidaemia.
REFERENCES
Policy for Articles with Open Access: Authors who publish with MedPulse International Journal of Community Medicine (Print ISSN: 2579-0862) (Online ISSN: 2636-4743) agree to the following terms: Authors retain copyright and grant the journal right of first publication with the work simultaneously licensed under a Creative Commons Attribution License that allows others to share the work with an acknowledgement of the work's authorship and initial publication in this journal. Authors are permitted and encouraged to post links to their work online (e.g., in institutional repositories or on their website) prior to and during the submission process, as it can lead to productive exchanges, as well as earlier and greater citation of published work.
|
|
|||||||||||||||||||||||||||||||||||||||||||||||||||||||||||||||||||||||||||||||||||||||||||||||||||||||||||||
 This work is licensed under a Creative Commons Attribution-NonCommercial 4.0 International License.