 Home
Home
|
Table of Content - Volume 19 Issue 3 - September 2021
First and second wave of COVID-19: A comparative study of tertiary care hospitalized patients in Jalgaon, Maharashtra
Yogita G Bavaskar1, Daniel A Saji2*, Ganesh S Lokhande3, Vilas R Malkar4, Jitendra B Surwade5, Sandip P Suryawanshi6, Satish K Suralkar7
1,4Associate Professor, 2,3,5,6Assistant Professor, Department of Community medicine, Government Medical College, Jalgaon, Maharashtra. 7Junior Resident, Department of Dentistry, Government Medical College, Jalgaon, Maharashtra, INDIA. Email: danielasaji@gmail.com
Abstract Background: Most of the countries including India have witnessed two or more waves of Covid 19 pandemic. The present study was conducted to compare the differences in clinico-demographic characteristics and outcomes of Covid 19 patients admitted in first and second wave of Covid 19 pandemic in a tertiary care hospital at Jalgaon, Maharashtra. Methods: A retrospective observational study was conducted at a tertiary care Dedicated Covid hospital for Covid 19 at Jalgaon, Maharashtra. All microbiologically proven corona positive patients were included in the study. The demographic records and clinical history was extracted from the case history sheets of the patients from first as well as second wave using standardized data collection form. Clinical outcome of the patients, i.e., development of complications, death or discharge was also recorded for each enrolled subject. Results: 3845 patients of Covid-19 admitted in the hospital during the first wave of epidemic and 2956 patients during second wave of the epidemic were included in the study. The mean age of patients admitted in the second wave was significantly lower as compared to first [48.77(15.31) years vs 50.23 (14.33) years, P<0.005]. There is increase in proportion of patients in the age group of < 15 years in second wave as compared to first wave (74/2956, 2.5% vs 52/3845, 1.3%). The number of patients requiring admission in ICU at the time of admission increased by 13% in second wave as compared to first wave. [827/2956 (28%) vs 577/3845(15%), P<0.0001]. More than half of the patients who got admitted for Covid 19 in first as well as second wave were having one or more comorbidities. But the proportion of the patients with previous co-morbities was significantly higher in second wave (1684/2956, 57% vs 1960/ 3845, 51%, P= 0.0004). The mortality was also higher in second wave (533/2956, 18.03% vs 541/3845, 14%, P=0.0004). Conclusions: The demographic, clinical characteristics and outcome of Covid 19 patients was different in first and second wave of pandemic with involvement of younger patients, increased rates of admission to ICU and more mortality in the second wave as compared to first wave of the pandemic. Key words: Covid 19, first and second wave of pandemic, demographic characteristics, outcome of Covid 19
INTRODUCTION Coronavirus disease 2019 (Covid 19) Pandemic originated from Wuhan China and rapidly spread to all the parts of the world.1 Several countries have witnessed multiple waves of upsurge of cases due to coronavirus disease (Covid 19) till date. In India, first case of Covid 19 was reported on 30th January 20202 and the WHO declared a corona pandemic on 11th march 2020. Till date there have been 3.3crore cases and 4.4 lakh Deaths due to covid 19 in India.3 Two distinct waves of epidemics were seen in India. There was a peak of first wave of epidemic with the daily cases of around 0.1 million in the month of September 2020, which decreased gradually with very few cases being reported during winter months and a renewed explosive increase in number of cases again from the month of February 2021.4 Studies done in Spain, Germany, Japan5,6,7 have elucidated the different characteristics and clinical presentation during subsequent waves of the epidemic. The new strains of virus,8 seroprevalence due to vaccination or natural infection, the novel epidemic management strategies and evolved understanding of clinical management of Covid 19 cases might have been responsible for different demographic and clinical presentation as well as outcome of disease during first and second wave of the disease in India. Jalgaon district is located in the northwest part of Maharashtra with estimated total population of 45.26 lac.9 Till now there have been 1,28,356 cases of covid 19 in Jalgaon district.10 There have been two distinct waves of epidemic due to Covid 19 in the district. The data of demographic characteristics and outcomes of the patients admitted in these two different waves of epidemic, in India is scarce. Data from such a study can guide us regarding the planning which can be done to be prepared for the impending third wave of epidemic, if it ever occurs. Therefore the present study was planned to systemically compare the demographic characteristics, disease outcome and mortality data of covid 19 patients admitted in first and second wave of the pandemic in this institute which served as a Dedicated covid hospital during both these waves of the epidemic.
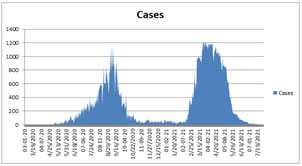
METHODS Study design: This is a retrospective observational study conducted at a tertiary care hospital at Jalgaon, Maharashtra which has been designated as a Dedicated covid hospital. This is one of the biggest Government hospital in Jalgaon with a total of 368 beds dedicated to COVID 19 patients in the first as well as second wave of the pandemic. Study Period: The first case of covid 19 was diagnosed on 29th march 2020 and so that was considered as the beginning of first wave. As seen in Figure 1, the number of cases of Covid 19 increased gradually thereafter attaining a peak of epidemic wave on 7th September 2020 with a maximum of 1185 new positive cases being detected on a single day. Thereafter the wave declined gradually to less than 50 new cases per day in the month of December 2020 and January 2021. From mid-February suddenly the cases started to increase. Within a month, the peak of second wave was attained on 24th march 2021 with 1223 new Covid 19 cases detected. In the month of April, every day more than 1000 new cases were detected which resulted in, the number of active cases being more than 10000 per day on most of the days. This led to a plateau phase at the peak. And thereafter from the month of May the number of cases started to decline rapidly with an average of less than 50 new cases detected in the month of June 2021. Therefore the first wave of the epidemic was considered from 29th March 2020 to 14th February 2021 and second wave from 15th February to July 31st. Inclusion and Exclusion criteria: We included all the patients who presented with Covid symptoms and were confirmed as a case of SARS- Cov- 2 infection with the help of RTPCR or Rapid antigen test. The SARS Cov-2 infection positive patients, who were referred from other hospitals were also included in the study. We excluded those patients who presented as a suspect of SARS-COV- 2 infection but tested negative for the virus on RTPCR test. Method of testing: The Reverse transcriptase polymerase chain reaction test was used for confirmation of the diagnosis of SARS- CoV- 2 infection. The throat swab and nasopharyngeal swab sample was collected from the suspected patients by trained personnel and was tested in Viral Diagnostic Lab of the institute. Patients who were tested positive from private labs and then referred to the institute were also included in the study. Ethical Clearance: The study was approved by institutional ethics committee and the anonymity of the data was maintained throughout the study. Data Collection: The records of age, gender, address, clinical presentation and co morbidities were extracted from the case history sheets of the patients from first as well as second wave using standardized data collection form. Clinical outcome of the patients, i.e., development of complications, death or discharge after getting cured was also recorded for each enrolled subject. Statistical Analysis: The demographic information, clinical presentation and outcome records from the data collection form was entered into Microsoft excel for further analysis. The age distribution of patients from both the waves was compared. The proportion of pediatric patients to adult patients was also compared of the two waves. Demographic and clinical data was presented using descriptive statistics and frequencies. Continuous variables are expressed as mean and standard deviation and were compared using T test. Categorical data has been expressed as numbers, percentages and proportions and analysed using chi square test. Statistical significance was set at P<0.05. Statistical analysis was performed using SPSS 23.0 statistical package. Ethical approval: approved by institutional ethics committee, Government Medical College, Jalgaon. RESULTS There were 3845 patients of Covid-19 admitted in the hospital in the first wave of epidemic and 2956 patients during the second wave of the epidemic. As seen in Table 1, the mean age of patients admitted in the first wave was 50.23 (14.33) years and for second wave it was 48.77(15.31) years. The comparative demographic profile of the admitted patients is presented in table no 1. A noteworthy feature in second wave is increase in proportion of patients in the age group of <15 years compared to first wave (74/2956, 2.5% vs 52/3845, 1.3%). While patient who are more than 45 years old were proportionately more in first wave as compared to second wave. (2625/3845, 67.3% vs 1868/2956, 63.1%). Majority, i.e, (2397/3845, 62.3%) of the patients who were admitted in the first wave were males. As compared to that the proportion of male patients reduced in second wave (1626/2956, 55%). In first wave 62% of patients were from Urban area and 38% patients were residents of rural area. In second wave, comparatively more (42%) patients were from rural area indicating improved referral services from rural area. Since this hospital was a Dedicated Covid hospital (DCH), majority of the covid patients were severe covid infection patients (Saturation <90 %). When condition at the time of admission was studied, it was found that the number of patients requiring admission in ICU increased by 13% (15% in first wave to 28% in second wave) in second wave as compared to first wave. The difference in rates of ICU admission, during first wave and second wave was statistically significant (Chi square- 171.6, P value < 0.0001) which suggest increase in the severity of the disease at the time of presentation. More than half of the patients who got admitted for Covid 19 in first as well as second wave were having one or more comorbidities.(Table 2) But the proportion of the patients with previous co-morbities was significantly higher in second wave (1684/2956, 57% to 1960/ 3845, 51%). (Chi square- 24.14, P= 0.0004). The comorbidities most commonly reported in first wave were Diabetes Mellitus (n=1577, 41%), Hypertension (n= 884, 23%), coronary heart disease (n= 123, 3.2%) similarly in the second wave, Hypertension (n= 1123, 38%) Diabetes mellitus (n=1064, 36%) and coronary heart disease (n= 107, 3.6%) were the most common comorbidities found. The other associated comorbidities which were found in both waves were Bronchial Asthma, Tuberculosis, Chronic kidney disease and Cancer. Throughout the study period a total 1074 deaths occurred in the institute. So the institutional mortality rate was 15.79%. On further analysis of the outcome of the admitted covid- 19 patients, it was observed that mortality was higher in second wave as compared to first wave. (533/2956, 18.03% to 541/3845, 14%) (Table 1). The increase in mortality in second wave was compared to the first wave and was found to be statistically significant (P<0.004). 86% patients in first wave were discharged after cured or were shifted to other hospital or left against medical advice. Since mortality was higher in second wave, patients who were discharged were lesser, i.e. 81.97%. It was also found that the mortality was more in the males as compared to females. In the first wave, 354 (65.4 %) of the total deaths occurred in Males and 187 (34.5%) deaths occurred in Females. (Table 3) This gender predisposition to deaths was found to be reduced in second wave with 314(58.9%) deaths in males and 219 (41.08%) deaths in Females. When the proportional mortality rates in wave 1 and 2 were studied, it was found that deaths predominantly occurred in age group >45 yrs. (87.1 % in first wave and 84.05%in second wave).(Table 4) The mortality among older age group (45 yrs and above) was significantly more in first wave compared to second wave.(87.1% in first wave vs 84% in second wave) Age specific mortality rate for age group < 15 years increased from 1.9 % in the first wave to 5.4% in second wave. Similar age specific mortality rates of all age groups were found to be increased in second wave as compared to first wave.
Figure 1: Graphical presentation of new cases per day since the beginning of the epidemic
Table 1: Demographic, clinical characteristics and outcome of the patients admitted in the first and second wave of Covid 19 pandemic at the institute
Table 2: Comorbities seen in Covid 19 patients in the first and second wave of pandemic admitted at the institute
Table 3: Gender wise mortality rates of patients admitted during Wave 1 and Wave 2 of the pandemic at the institute
Table 4: Age wise and wave wise mortality rates of patients admitted in the institute
(ASMR : Age Specific Mortality Rate ; PMR : Proportional Mortality rate) DISCUSSION Similar to the pattern which is seen in India and many other countries, two waves of epidemic were seen in Jalgaon district. 4,5,6,7 The pattern which was observed in first wave of epidemic was a gradual rise and gradual fall in cases, with a single peak in the month of September 2020. The reason behind this pattern of epidemic wave might be the presence of strict countrywide lockdown, locking of district borders, strict containment measures, rigorous contact tracing and fear in the mind of people due to which very less community mixing took place and the disease could not spread rapidly in the community. But with declining cases, the lockdown restrictions were removed. There were major festivals, Eid, Diwali and other events such as marriages which resulted in community gatherings and lack of Covid appropriate behavior during this period. Also due to vaccination hesitancy,11 vaccination coverage remained below expected. Also, the SARS-CoV-2 double-mutant strain B.1.617, possessing the key structural mutations Glu484Gln and Leu452Arg in the spike protein was found to be is highly infectious and was considered the central cause of the COVID-19 surge in India during the second wave.12 All these factors were responsible for the second wave of Covid 19 epidemic, which was more explosive with rapid rise, sustained peak and rapid fall in the cases.13 The explosive nature of second wave resulted in huge burden on healthcare system. Most of the hospital beds including beds in this institute were totally occupied in the second wave of the epidemic. The demographic and clinical characteristics of the Covid 19 patients admitted in these two waves of the epidemic were also found to be different. In the first wave majority of the patients were elderly, but in second wave, shift towards younger age group was seen. Similarly Jain V K et al.14 also mentioned in their article that SARS- CoV-2 infected patients in the first wave were predominantly older than 60 years and those with comorbid conditions were at increased risk of infection and death. But, in contrast, younger adults were seen to be more susceptible to infection during the second wave and many patients even died at a younger age, including patients between 25 and 50 years.14 There were very few pediatric patients affected in first wave, compared to that, in second wave the number was proportionately higher. The mean age of the Covid 19 patients was lower in second wave as compared to first. The similar pattern of younger age group involvement was observed in other studies conducted in India and other countries like Spain, Japan and various European countries.5,7,14,15 The most probable reason seems to be lack of following covid appropriate behavior amongst younger age group individuals. Also, since they are usually the earning members of the family, they have to step out of the house. There were more males affected than females in both the waves of the epidemic. Around 2/3rd of the total patients admitted during first wave and around half of the patients in the second wave were males. The studies done in China and Europe also found higher susceptibility of men to develop severe respiratory disease following SARS-CoV2 infection, leading to more hospital admissions and deaths.16,17 Sex differences in ACE2 and TMPRSS2 regulation, differential immune responses to viruses mediated by sex hormones might be some of the factors leading to susceptibility of men to severe covid 19 infection. (16) Since the hospital is situated in Urban areas and relatively better testing and referral services in Urban area, majority of patients admitted in the institute were from Urban areas in both the waves. Improved surveillance and better understanding of the disease might be the factors responsible for the increased proportion of rural patients in second wave. The second wave of epidemic in India was explosive in nature, resulting in many patients getting diagnosed as Covid 19 positive each day, leading to severe burden on healthcare system. According to central and state government guidelines, the mild category Covid 19 patients were isolated in Covid care centers or allowed to be in Home Isolation. The moderate category Covid 19 patients were managed in Dedicated Covid Health Center and Severe category patients with saturation less than 90 were admitted at DCH. This institute being a Dedicated Covid Hospital catered to severe patients. It was found that the presentation of the disease was more severe in second wave as 28% of the patients required ICU admission at the time of presentation as compared to 13% patients in the first wave. This changing clinical presentation of the disease can be because of the SARS-CoV-2 double-mutant strain B.1.617 which is said to be more infective and virulent.12 Covid 19 is said to cause a more severe disease in patients with comorbidities.18,19 In our study 51% of patients in the first wave and 57% patients in the second wave had one or more previous morbidities. In second wave, as more than half of the patients were suffering from previous illnesses. This might have also contributed to increased severe presentation of the disease and greater mortality in wave two. Hypertension, Diabetes mellitus, Coronary heart disease were the most commonly associated co-morbidities in both the first as well as second wave of the disease. The virulent strain of virus, explosive nature of the epidemic and presentation of the patients to the hospital in serious condition, in the late stage of the disease lead to higher mortality among the hospitalized Covid 19 patients in second wave as compared to first wave.12 This is in contrast with the research done by Fan G et al.(20) in 53 countries, where case fatality rate was found to decrease in second wave. As discussed earlier, deaths were found to be more in Males which again highlights the different susceptibility of both sexes to the severe disease and deaths. Similarly, in the study conducted by Gebhard C (16) and Jim JM et al.17 the mortality rates were 2.4 times higher for males as compared to females. Also, when proportional mortality was studied, the mortality was found to be highest in the older age group (45 yrs and above) in first wave compared to that in second wave. In First wave very few children developed severe disease or deaths but in second wave age specific mortality for the age group <15 years was more as compared to first wave, which again suggests changing demographic pattern of the disease. These findings were similar to study done Jain V K et al.14
CONCLUSION The two waves of the Covid 19 pandemic have highlighted the significant changes in clinico-demographic characteristics among the patients who presented to the institute. The main characteristics being the involvement of people of lower age groups, a rapid increase in the number of serious patients requiring ICU care at admission and with co-morbidities in second wave. The most common comorbidities which led to severe outcomes like death were Diabetes Mellitus, Hypertension and Coronary Heart Disease. Also, there was a changing trend of increased mortality shifting age groups from the old age to the younger age groups. The decrease in the use of Covid appropriate behavior among the general public and the loosening of strict lockdowns led to the rapid increase in the number of patients and the burden on the health care facilities has underlined the need for strengthening health care resources in the country for future surges in the pandemic which may occur in the future.
ACKNOWLEDGEMENTS We acknowledge, Dean, Government Medical College, Jalgaon, Maharashtra for his cooperation in the research.
REFERENCES
Policy for Articles with Open Access
|
|
|||||||||||||||||||||||||||||||||||||||||||||||||||||||||||||||||||||||||||||||||||||||||||||||||||||||||||||||||||||||||||||||||||||||||||||||||||||||||||||||||||||||||||||||||||||||||||||||||||||||||||||||||||||||||||||||||||||||||||
 This work is licensed under a Creative Commons Attribution-NonCommercial 4.0 International License.