 Home
Home|
Table of Content - Volume 13 Issue 2 - February 2020
Study of basic finger print patterns and their association with blood groups
Thomas Jerry1, Prathilash K2*, B Umadethan3
1Assistant Professor, Department of Forensic Medicine and Toxicology, Sree Narayana Institute of Medical Sciences, Chalakka, Kuthiyathode Po, Ernakulam, Kerala, INDIA. 2Assistant Professor, Department of Forensic Medicine and Toxicology, Malabar Medical College Hospital and Research Centre, Ulliyeri, Kozhikode, 673323 Kerala, INDIA. 3Formerly Professor & HOD, Department of Forensic Medicine and Toxicology, Amrita Institute of Medical Sciences, Ernakulum, Kerala, INDIA. Email: drjerrythomas@gmail.com Abstract Background: As criminal offences in the country are on the rise and the offenders are clever enough to destroy the evidences, any trace evidence like fingerprint, blood stains gain utmost importance. So, any correlation with the trace evidences is very important for further investigation of the crime. Aim: To find out correlation between finger print pattern and blood group of an individual. Material and Methods: In this study, the basic three finger print patterns of 250 medical students were compared with their ‘ABO’ blood groups. Rhesus factors were not included. In one method, for collection of fingerprint, a plain glass plate of 12x12 inches was cleaned uniformly smeared with a thin layer of black printers ink by using the inking roller. And in second method, LEE Finger Print Pad were used to take 100 finger prints. Results: Of the 4 blood groups, majority of the subjects were from ‘O’ group (96 - 38.4%) followed by 'B’ (79-31.6%), ‘A’ (59-23.6%) and ‘AB’ (16 - 6.4%) groups. In the majority of the subjects, loops were the most commonly seen finger print pattern (1513-60.52%). Loops were most commonly seen in ‘O’ blood group (546 - 36.08%). This was closely followed by prevalence of loops in B blood group (492 -32.51%). Loops were least seen in ‘AB’ blood group (19-7.6%). Conclusion: The prediction of blood group of a person is possible to an extent on the basis of the person’s fingerprint pattern. Key Word: Fingerprint, blood group, Loop, Whorl, Arches
INTRODUCTION Dermatoglyphics or dactylography has long been recognized as a scientific and valuable method for medico-legal, anthropological and genetic studies.1 Dactylography is the process of taking the impressions of the papillary ridges of the fingertips for the purpose of identification of a person. Identification by this method is absolute; without any chance of error.2 Identity is a set of physical characteristics, functional or psychic, normal or pathological that defines an individual. To establish the identity of a person identifying features are to be noted. Fingerprints are constant and individualistic and form the most reliable criteria for identification.3 As criminal offences in the country are on the rise and the offenders are clever enough to destroy the evidences, any trace evidence like fingerprint, blood stains gain utmost importance. So, any correlation with the trace evidences is very important for further investigation of the crime. This study was an attempt to find out correlation between finger print pattern and blood group of an individual. This would throw some light to restrict the field of searching and narrow the line of investigation.
MATERIAL AND METHODS The present study was conducted in the Department of Forensic Medicine and Toxicology, AIMS School of Medicine, Kochi with the help of the Department of Transfusion Medicine, AIMS School of Medicine and Fingerprint Bureau, Ernakulam. Study Group The study group comprised of medical students of AIMS School of Medicine. Students from each respective year (1st year, 2nd year, 3rd year and 4th year) were being randomly selected from Amrita School of Medicine. Sample size Sample size based on the percentage distribution of subjects with respect to finger print patterns loops, whorls, arches and with 95% confidence and 20% allowable error, minimum sample size came to 575 arches, 100 loops and 180 whorls. Due to the constraint of time period, I included a total of 250 subjects. This gives the estimate with 30% allowable error for arches, 13.0% allowable error for loops and 18.0% allowable error for whorls. Inclusion criteria
Exclusion criteria
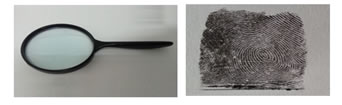
Methodology Method 1 The subject was asked to wash and dry their hands to remove dirt and grease. For collection of fingerprint, a plain glass plate of 12x12 inches was cleaned uniformly smeared with a thin layer of black printers ink by using the inking roller. The subject was asked to keep his/her arm relaxed and not to try to help in rolling the fingers as this may cause smearing. Then the finger bulbs were rolled on the glass slab. The thumbs were rolled towards the subject’s body and the fingers were rolled away from the body, i.e. thumb in fingers out method. Then the impressions of each finger were obtained in the allotted space for that finger on the proforma. In this way for each and every individual the entire prints of ten fingers were prepared. Only plain prints were taken. Figure 1: Printer Micro Inks Figure 2: Glass plate 12x12 inches Figure 3: Ink roller
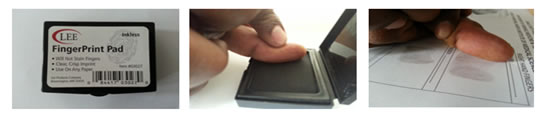
Fig. 4: Magnifying lens Fig. 5: Fingerprint on proforma Method 2 Pre-inked pad, also known as LEE Finger Print Pad, measuring, 6 x 4.5 cm where the ink is company filled and can be used to take 100 finger prints was used. Advantages of this finger print pad are - will not stain fingers, clear, crisp print are obtained and can be used on any paper. The recording of fingerprints was similar to that of procedure 1, except that instead of the glass Figure 6: LEE finger print pad Figure 7: Pre-inked pad Figure 8: Clear, crisp fingerprint slab finger print pad was used. A single finger print was used for 60 subjects.BLOOD GROUPING Blood group of the subjects, being medical students had already been determined by the Amrita Blood Bank and documented. Therefore, a subsequent test was not needed. The information was obtained from the following records medical records, blood donor’s forum and driving license. Statistical analysis Percentage distribution of different finger print patterns according to different fingers and according to blood groups were computed and tabulated. To test the statistical significance of the association of blood group and finger print pattern at each finger and also for the total fingers Chi-square test was done. p-value of less than 0.05 was taken as statistically significant. Statistical analysis was done using SPSS-version 20.
RESULTS It was observed that loops (60.80%) showed the highest percentage in thumb, followed by whorls (37.00%) and arches the least seen (2.20%). In the index fingers loop (50.60%) patterns showed the highest percentage, followed by whorl pattern (36.20%) and arches were the least (13.20%). In the middle fingers loop (66.20%) patterns showed the highest percentage, followed by whorl (26.00%) and arches were the least (7.40%). In the ring fingers the whorl pattern (48.00%) was the commonest followed by loop pattern (47.60%). Arch pattern was the least seen. The little fingers showed highest number of loops (77.20%), followed by whorl pattern (20.00%) and the least was arch pattern (2.28%).
Table 1: Distribution of pattern of finger prints in different fingers of both hands of subjects
The basic finger print patterns of both right thumbs were compared with the four blood groups. Loop prints were more in ’O’ blood group (36.80%) and least seen in ‘AB’ blood group (7.90%). Whorl was seen commonly in ‘O’ blood group (41.60%) and least seen in ‘AB’ blood group (4.30%). Arch was seen in ‘B’ blood group (72.70%) and ‘O’ blood group (27.30%) absent in ‘A ‘and ‘AB’ blood groups. Distribution of finger print patterns in relation to blood groups among the thumb fingers was statistically significant.
Table 2: Distribution of finger print patterns in both thumbs in relation to blood groups
P-value: 0.032 In both index fingers loop pattern was most commonly seen in ‘O’ blood group (34.80%) and least common in ‘AB’ blood group (6.70%). In the right index finger whorls were commonest in’ O’ blood group (44.20%) and least in ‘AB’ blood group (5.50%). Arch was seen mostly in ‘O’ blood group (36.40%) and least common seen in ‘AB’ blood group (7.60%).
Table 3: Distribution of finger print patterns in both index fingers in relation to blood groups
P-value: 0.621 The loop pattern in both middle fingers showed the highest in ‘O’ blood group (38.40%) and the least number in ‘AB’ blood group (6.60%). In the Right middle finger the whorl finger print pattern was highest in ‘O’ blood group (42.70%) and least seen in ‘AB’ blood group (4.60%), Arch was commonly seen in the ‘B’ blood group (43.20%) and least seen in the ‘AB’ blood group (10.80%). Table 4: Distribution of finger print patterns in both middle fingers in relation to blood groups
P-value: 0.177 In both ring fingers whorls were most commonly present in the ‘O’ blood group (44.20%) and least in ‘AB’ blood group (6.20%). Loops were commonly seen in the ‘B’ blood group (35.70%) and least in the ‘AB’ blood group (7.10%). In the ring fingers arch print was most commonly seen in equal percentages in ‘O’ and ‘B’ blood group (36.40) and nil in the ‘AB’ blood group.
Table 5: Distribution of finger print patterns in both ring fingers in relation to blood groups
P-value: 0.175 Both little fingers showed the highest number of whorls present in ‘O’ blood group (50.00%) and the least number in ‘AB’ blood group (7.00%). Whorls were the highest seen finger print in ‘O’ blood group (36.30%) and the least seen in ‘AB’ blood group (6.50%). Arch pattern was highest seen in the ‘B’ blood group (50.00%) and nil in ‘AB’ blood group. Distribution of finger print patterns in relation to blood groups among the little fingers was statistically significant. Table 6: Distribution of finger print patterns in both little fingers in relation to blood groups
P-value: 0.012
DISCUSSION In this study the basic three finger print patterns of 250 medical students were compared with their ‘ABO’ blood groups. Rhesus factors were not included. Of the 4 blood groups, ‘B’, ‘O’, ‘A’ and ‘AB’, majority of the subjects were from ‘O’ group (96 - 38.4%) followed by 'B’ (79-31.6%), ‘A’ (59-23.6%) and ‘AB’ (16 - 6.4%) groups. In the majority of the subjects, loops were the most commonly seen finger print pattern (1513-60.52%). Loops were most commonly seen in ‘O’ blood group (546 - 36.08%). This was closely followed by prevalence of loops in B blood group (492 -32.51%). Loops were least seen in ‘AB’ blood group (19-7.6%). Whorls were the next commonly seen finger print pattern in this study (837-33.48%). Similar to the loop, whorls were seen most commonly in O blood group in (367-43.84%). This was closely followed by B blood group (241-28.79%) and least in AB blood group (45-5.37%). Arches were the least common finger print pattern smallest in number (150-6% ). Unlike other blood groups, arches were most commonly seen in B blood group (57-38%). It was closely followed by O group and was seen least in AB group. The present study revealed that highest incidence of loops were seen in blood group O followed by B. This result was different when compared to the studies done on 305 Libyan medical students by Fayrouz and associates.4 Their study revealed that blood group A and O had highest incidence of loops. In a research study done at Gutnur by Muralidhar Reddy Sangam and associates5 on 506 individuals, loops (56.21%) were the commonest finger print pattern followed by whorls (39.47%) and then arches (4.4%). This was similar to the current study where loops (60.52%) were the commonest, followed by whorls (33.48%) and lastly by arch (6%). According to Muralidhar et al,5 loops were highest in ‘O’ group (58.8%) and least in AB (50%). Similar observation is seen in the current study. Loops being the highest in O group (36.08%) and least in AB group. In the work done by Desai Bhana in Karnataka on 200 subjects,6 it was found that the loops in all the digits were 1178 (58.9%) followed by whorls which was 592(29.6%). Numbers of arches were 230 (11.5%). Loops were highest in incidence. This was similar to the current study, where loops were (60.52%) commonest, followed by whorls (33.48%) and lastly by arches were (6%).One more similar distribution of primary finger print patterns was seen in the study of Umranya and colleagues.7 They also had highest incidence of loops (51.54%) followed by whorls (35.79%) and lastly by arches (12.67%). For all the fingers except left little in all blood groups, the association with fingerprint patterns was statistically insignificant (p valve>0.05). This was when each finger was compared with the fingerprint patterns in the four blood groups statistically. Similar insignificant statistical association was seen in the work done by Dennis. E.O. Eboh Delta State University, Nigeria.8Kshirsagar et al9 reported that the distribution of fingerprint patterns in A, B, AB and O blood groups were not statistically significant. In a study carried out among Delta state University students, Abraka, Odokuma et al10 also revealed that there was no significant association between thumb print patterns and ABO blood groups. There is a significant association between finger print and blood group in both the thumbs and little fingers. The p-value for the thumbs was 0.032 and in little fingers it was 0.012. Hence, according to the statistical interpretation, it is possible to find out the blood group of a person from the finger prints left at a crime scene using thumb or little finger. Similar significant statistical study was seen in Noor Eldin Fayouz and associates.4 CONCLUSION Based on the results of this study, it is hereby concluded that the prediction of blood group of a person is possible to an extent on the basis of the person’s fingerprint pattern.
REFERENCES
|
|
|||||||||||||||||||||||||||||||||||||||||||||||||||||||||||||||||||||||||||||||||||||||||||||||||||||||||||||||||||||||||||||||||||||||||||||||||||||||||||||||||||||||||||||||||||||||||||||||||||||||||||||||

 This work is licensed under a Creative Commons Attribution-NonCommercial 4.0 International License.