 Home
Home
|
Table of Content - Volume 17 Issue 3 - March 2021
Trends of caesarean delivery in a teaching hospital by Robson’s criteria
Pradeep MR1, Bharathi P2*
1Associate Professor, 2Assistant Professor, Department of OBG, CIMS, Chamarajanaga, INDIA. Email: drbharathi96@gmail.com
Abstract Background: Caesarean delivery is a part of standard care in obstetrics, when there is a substantial risk to the mother or fetus by vaginal delivery or when vaginal delivery is impossible. It has been seen that there is an increasing trend of caesarean delivery in both developing and developed countries from 1990 till date than WHO guidelines. Aims and Objectives: To find out the trends of caesarean delivery and classify according to Robson’s criteria in our hospital. To evaluate high C-Section rate in Robson’s group and to implement hospital based protocol to reduce caesarean delivery. Materials and Methods: A retrospective study was conducted in the department of Obstetrics and Gynaecology at CIMS, Chamarajanagara by obtaining case records from medical record section from January 2017 to December 2019. Results: We had a total of 3344, 3644 and 4147 deliveries in 2017, 2018 and 2019 respectively. The overall C-Section in 2017 was 1301(37.1), 1441(39.5%) in 2018 and 1697(40.9) in 2019 Conclusion: C-Section rate is higher in our hospital than WHO guidelines. . Around 50% of C-Section are referred cases from periphery due to lack of facilities. In this study there is an increasing trend of caesarean delivery observed from 2017 to 2019 Over 75-80% of caesarean delivery occurred in Group I,II and Group V of Robsons Criteria. Fetal distress, Prolonged pregnancy with failed induction, Non progress of labour and Repeat Caesarean section were the most common indications. Adapting hospital based protocol for diagnosis and management of above indications will certainly help in reducing C-Section rate. Key words: Caesarean delivery, Robson’s criteria, Vaginal delivery
INTRODUCTION Caesarean delivery is a part of standard care in modern obstetrics, when there is a substantial risk for the mother or the fetus by vaginal delivery or when vaginal delivery is not possible. It has been seen that there is an increase in trend of caesarean [C –Section] rates from decade to decade in both developing and developed countries from 1990-2014. Results from 150 countries globally shows average C- section rates increased from 6.7% to 19.1% from 1990-2014. Largest absolute increase has occurred in Latin America and the Carribean [19.4% from 22.8% to 42.2%], Asia [15.1% from 4.4% to 19.5%], Europe [13.8% from 11.2% to 25.2%], Northern America [10% from 22.3% to 32.3%].1. In 1985 , WHO proposed the ideal rate of caesarean delivery to be between 10-15%2. Despite the lack of scientific evidence indicating any substantial maternal and perinatal benefits from studies showing higher rates of C- section could be linked with negative consequences in maternal and child health3,4,5. C-section increases risk of anaesthesia complications, blood transfusion, infections, thrombo-embolic diseases, neonatal respiratory diseases6. It has been associated with increased risk of asthama, obesityin children, uterine rupture , placenta accreta, placenta previa, ectopic pregnancy, infertility, intra abdominal adhesions as long term complications in mothers7. The reasons for increase in C- section rates are multifactorial and not well understood. Changes in maternal characteristics and professional practice styles, increase in malpractice pressure as well as economic,organisational , social and cultural factors have all been implicated in this trend8,9,10,11 . Use of unnecessary C-section imposes financial burden in health system12. The lack of standardised internationally accepted classification system to monitor and compare C-section rates in a consistent and action oriented manner is one of the factors in preventing and understanding of the trend and underlying causes13. To have standard, systematic, simple classification of C-section rates, both WHO in 2014 and FIGO in 2016 recommended Robson’s Classification to assess caesarean section rates14,15. This ten Group Robson’s Classification gives us to see C-section is increasing in which groups and to compare the same with other institutions and standardise the protocols of C-section rates.
AIMS AND OBJECTIVE
MATERIALS AND METHODS This is a retrospective study, done in the department of obstetrics and gynecology at a teaching hospital of Chamarajanagar institute of medical sciences, Chamarajanagar.After obtaining approval from the ethical committee, case records of the women who underwent caesarean delivery were retrieved from medical record section of the hospital from January 2017 to December 2019. The details like spontaneous labour or induced labour, parity, indications for caesarean delivery, period of gestation were recorded in the prescribed proforma and classified based on the “ Ten Group Robsons Classification ”. Data collected was written in a tabular column, group wise and year wise and were compared with one another.
ROBSON’S CLASSIFICATION Table 1:
Higher C-section rate groupwise in our hospital were assesd in detail, and we tried to design the hospital based protocols to reduce the c-section rate.
OBSERVATIONS AND RESULTS We have Collected the data of C – section from medical record section from January to December yearwise ie in 2017, 2018 and 2019 and tabulated as below. Table 2
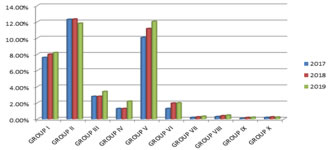
Figure 1:
In our hospital we had 3544, 3644, 4147 deliveries in 2017, 2018, 2019 respectively. The overall C-section in 2017 was 1301(37.1%), in 2018 it was 1441(39.5%), and 1697(40.9%) in 2019. Increase in trends of C- Section rates is seen from 2017-19. Caesarean delivery was higher in Group II followed by Group V In 2017 and 2018. In Group- II it was 12.3% and 12.34% in 2017 and 2018 respectively , where as in Group V it was 10.07% and 11.17% in the respective years. In 2019 C- Section deliveries in Group -V was 12.05% followed by Group –II of 11.82% . Increase in trends of C- Section rate is also seen in Group I , It was 7.6% in 2017 , 8% in 2018 and 8.2% in 2019. There is an increase in trends of C-section rates in group II and group V over a period of 3 years. In group II fetal distress was most common indication, whereas in group V repeat C-section for previous caesarean was more common indication.
DISCUSSION Rise in trends of caesarean delivery is seen all over the world from the past 30 years. Multiple facts are involved for this trend. Robsons classification for C- section gives us an idea regarding the rising trend groupwise, which then help us to analyse and relook into these groups to formulate protocols and to decrease the rising trend. Robson’s criteria for caesarean deliveries is simple, effective way of auditing caesarean deliveries in the hospital. In our study we have seen overall rising trends of caesarean sections from 2017 to 2019 from 37% to 40%, same trend is seen all over the world1. we also found that group II and group V are major contributors of caesarean deliveries in all the three years. These two groups comprises 50% of caesarean deliveries in our hospital in all the three years section is not done in so many CHC and Taluk Hospitals in our district. Due to lack of facilities most of the pregnant women are referred from the periphery, all over the district to our hospital for caesarean delivery. Around 50% of C-sections are referred from Periphery as elective and emergency C-section. Over 75% to 80% of caesarean deliveries occurred in group I, II, and V in all three years in this study. Same observations is seen in a study of C-section rate in Brazil by Marcus – Nakumura Pereira et al.15 and 16, where as in a study Lafitte et al. in France in 2014 showed higher number of C-section in group V and group II24. Most common indication for caesarean delivery in group I was fetal distress, in group II Prolonged Pregnancy with failed induction/non progress of labour where as in group V it was repeat C-section for previous caesarean delivery In group II most of the C –section were due to failed induction. ACOG ‘s recent guidelines recommends to restrictthe number of caesarean deliveries which are non medically indicated and induction of labour before 39 weeks of gestation19. Most of the case records did not show proper indication, probably hospital based protocols for induction of labour is the need of the hour to decrease this trend and we should be as evidence based as possible in recommending an induction of labour21-23. In our study it is observed that C-section was done for fetal distress, for just FHR abnormality (fetal tachycardia/bradycardia), meconium stained liquor without monitoring for adequate time and clinical resuscitation (left lateral position, oxygenation and hydration). The adoption of FIGO Consensus guidelines on Intra partum fetal monitoring17– (as baseline FHR less than 100bpm or more than 180bpm, with reduced variability for more than 50 minutes, increased variability for more than 30 minutes or sinusoidal pattern of FHR for 30 minutes, repetitive late or prolonged deceleration for more than 30 minutes or more than 20 minutes if reduced variability or one prolonged deceleration more than 5 minutes.) for detection of fetal distress will help in reducing C-section rate in group I. In group II C-section was common for women with prolonged pregnancy with 40 weeks + 1 day to 40 weeks + 6 days POG with failed induction or non-progress of labour. Whereas it is recommended to induce labour at 41 weeks for all low risk pregnancy if BPP is normal to reduce C-section rate by review Cochrane data base in 201218. WHO analysis showed that the proportion of women with previous caesarean delivery and absolute contribution to group V has increased in recent years20. In Our study in groupV most of the post caesarean pregnancy were taken for repeat C-section without trial of labour. By Counselling the previous C- Section pregnancies for VBAC(vaginal birth after caesarean ) during antenatal period and improving the facilities for trial of labour will improve VBAC rates and will certainly help in reducing C-section rates in group V. We need to standardise our hospital protocols to opt for conduction of VBAC to decrease this trend
CONCLUSION C-Section rate is higher in our hospital than WHO guidelines. Around 50% of C-section are referred one from periphery due to lack of facilities. In this study there is an increase in trends of Caesarean observed from 2017 to 2019. Over 75-80% of Caesarean delivery occurred in Group-I , II and in Group V of Robson’s Classification of Caesarean delivery. Fetal distress , ( Group I) Prolonged pregnancy with failed induction /Non progress of labour (Group-II) and Repeat Caesarean Section for previous Caesareanpregnancy (Group-V) were most common indications. Adapting Hospital based protocols for diagnosis and management of above indications will certainly help in reducing C- Section rate.
REFERENCES
Policy for Articles with Open Access
|
|
|||||||||||||||||||||||||||||||||||||||||||||||||||||||||||||||||||||||||||||||||||||||||||||||
 This work is licensed under a Creative Commons Attribution-NonCommercial 4.0 International License.