 Home
HomeOfficial Journals By StatPerson Publication
|
Table of Content - Volume 10 Issue 1 - April 2019
Accuracy of admission Torniquet test in the diagnosis of early stage of dengue infection as compared with NS1 antigen
Deepraj U Adhikari1*, Triza C Baliuag2, Armi Luna S Estanislao3, Michael M Resurreccion5
1Fellow Neonatology, Rainbow Children Hospital, Marathahalli, Bangalore, Karnataka, INDIA. 2Department of Pediatrics, Quirino Memorial Medical Centre, PHILIPINES. Email: adhikarideeprajmd2@gmail.com
Abstract Objective: To determine the accuracy of the admission tourniquet test in the diagnosis of early stage of dengue infection as compared with NS1 antigen. Design: A prospective cross-sectional study design. Setting: Tertiary Government Hospital in Quezon City Participants: Subjects included children 6 months to 18 years of age admitted for fever of five days or less. Tourniquet test was done simultaneously with NS1antigen on admission. Main outcome measure: Accuracy of tourniquet test as compared with Ns1 antigen was determined through sensitivity, specificity, predictive value, likelihood ratio and Receiver Operator Curve. Result: Four hundred subjects were enrolled in the study. The prevalence of dengue infection in this study is 56.25% (95%CI 51.23, 61.17). The overall accuracy of tourniquet test relative to NS1ag is 81.30% (95% CI 77.13 - 84.77%). The sensitivity of tourniquet test using NS1 antigen as the gold standard was 88.89% (95% CI 84.04%, 92.68%); its specificity was 71.43% (95% CI 64.12%, 77.99%). The positive predictive value of tourniquet test as compared with NS1antigen was 80.00% (95%CI 74.50%, 84.78%), its negative predictive value was 83.33% (95% CI 76.39%, 88.91%). The positive likelihood ratio of tourniquet test relative to NS1antigen is 3.11 (95%CI 2.45, 3.95) with a negative predictive value of 0.16 (95% CI 0.11, 0.23). The Area Under the Curve is 0.804 (95%CI 0.76, 0.84). Conclusion: The tourniquet test is a simple, accurate and readily available diagnostic test for dengue infection. The accuracy of admission tourniquet test is comparable with NS1 antigen. Key Word: children, dengue infection, tourniquet test, NS1 antigen, test of accuracy.
INTRODUCTION Dengue is the most prevalent mosquito-borne viral disease in humans, occurring in tropical and subtropical countries of the world where over 2.5 billion people are at risk of infection.1 The World Health Organization has estimated that 50 million cases of dengue fever and several hundred thousand cases of dengue hemorrhagic fever occur each year, depending on the epidemic activity.1 Some 1.8 billion of the population at risk for dengue worldwide live in member states of the WHO South-East Asia Region and Western Pacific Region, which bear nearly 75% of the current global disease burden due to dengue.1 The National Epidemiology Centre of the Philippines' Department of Health reports a total of 59,943 dengue cases from January 1 to September 6, 2014. This is 59.57% lower compared to the same time period in 2013(148,279). Majority of the infected patients were 5 to 14 year old children (38.91% of the total cases), and more than half were males (52.77%). A total of 242 deaths (CFR 0.40%) were recorded since January 2014, and most of them were children.2 Dengue infection has conventionally been classified into three grades of severity: dengue fever (DF), dengue hemorrhagic fever (DHF) and dengue shock syndrome (DSS) (WHO 1997)3 or more recently as dengue, dengue with warning signs and severe dengue (WHO 2009). Although clinical diagnosis of DSS is usually straightforward, DF and DHF can be difficult to distinguish clinically from a wide range of undifferentiated fevers, such as typhoid, typhus, malaria, leptospirosis and chikungunya virus infection.4 Early recognition of dengue is challenging because the initial symptoms are often non-specific, viremia may be below detectable levels and serological tests confirm dengue late in the course of illness. Prompt diagnosis during the febrile stage is essential for adjusting appropriate management.5 The laboratory diagnosis of dengue is usually based on serological ELISA tests, which detect specific IgM or IgG antibodies and ⁄ or NS1 antigen during the acute phase of infection. However, these methods are not commonly available in many dengue-endemic countries and there are other factors to consider, such as requirement of a highly trained staff, sophisticated equipment, cost factor and time constraints.6 In the last few years, Dengue Virus Non-structural 1 (NS1) antigen has emerged as a useful biomarker which has been found to be present in the serum of patients during the early stages of infection. A number of studies done to evaluate the utility of NS1 antigen have underlined its importance in identification of this infection. NS1 antigen is detectable in blood from the first day after the onset of fever up to Day 9, even if the clinical phase of the disease is over it is still detectable even when viral RNA is negative by polymerase chain reaction and in the presence of IgM antibodies.7 Diagnosis of dengue is done by detection of genomic material by RT-PCR early during infection and with serological assays (detection of IgM and IgG) at later time points. Currently, NS1 antigen captures ELISA and rapid NS1 antigen commercial kits for detection of NS1 antigen are available in the market. Studies have revealed the detection rate of NS1 antigen to be higher in acute primary dengue than in acute secondary dengue infection. Its use has been suggested for early diagnosis of dengue infection after the onset of fever.8 Nevertheless, cost remains an impediment in the wide-scale adoption of these assays in poor and under-served areas that are often disproportionally affected by dengue. Therefore, diagnosis should rely on more readily available and affordable parameter. The tourniquet test (TT) is a physical examination technique that can identify and stratify dengue disease. Infection with dengue virus may result in increased capillary permeability, a physiological state that the TT achieve by applying sustained pressure to these small vessels.9 The resulting petechiae (cutaneous pinpoint, non-raised, purplish-red spots) can be found in patients with DF and DHF. The 2009 World Health Organization Dengue Guidelines for Diagnosis, Treatment, Prevention, and Control listed a positive TT result as a criterion for the diagnosis of probable dengue.4 Despite the widespread use of the TT in dengue clinical and research settings, little is known about the performance of this test across demographic groups and epidemiologic conditions. This paper aims to answer the research question among children admitted in a tertiary government hospital in Quezon City, on how accurate is the admission tourniquet test for the diagnosis of early stage of dengue infection as compared with NS1 antigen. Significance of the study: Dengue is a very challenging disease to diagnose in its early stage. It is a difficult task for a physician to promptly diagnose and treat dengue fever/dengue hemorrhagic fever. Tourniquet test is easy to perform and can be done in a health centre or in a private clinic which is convenient for the patient and the physician. This study which determines the accuracy of tourniquet test if found significant can facilitate the early detection and management of dengue in the absence of the most up-to-date laboratory test. More over in developing countries where modern laboratory tests are not readily available, tourniquet test could be a cost efficient, non-invasive and a reliable tool to diagnose dengue fever/dengue hemorrhagic fever. As per WHO guidelines in 2009 a positive tourniquet test is a criterion for diagnosing probable dengue. Therefore, if the result of this study is significant it could be a part of the new guidelines in the diagnosis of dengue fever/dengue hemorrhagic fever. General Objective: To determine the accuracy of admission tourniquet test in the diagnosis of early stage of dengue infection as compared with Ns1 antigen. Specific Objective To determine the accuracy of admission tourniquet test with NS1antigen in terms of:
MATERIALS AND METHODS Study Design: This is a cross sectional study design on the diagnostic accuracy of the tourniquet test in dengue infection using NS1 antigen as the gold standard. Study Population: Patients eligible for the study are children, 6 months to 18 years of age, admitted for fever of 5 days or less with written informed consent and assent as deem necessary. Patients with chronic illness such as, primary Koch’s infection, leukemia, chronic kidney disease and malnourished children were excluded in this study. Sample Size Computation: The sample size was computed based on the 2011 study by Laos’s et.al, in the accuracy of tourniquet test. At a 95% confidence interval and 7% maximum allowable error, a sensitivity of 34% and a specificity of 84%, and a prevalence of 50% positivity, the sample size computed was 352. Definition of Terms
Statistical Analysis: The qualitative and quantitative variables were analysed using descriptive statistics. Counts and percentages for qualitative variables, means and standard deviations for normally distributed quantitative variables, median and interquartile range (IQR) for non-normally distributed quantitative variables. (Mean, std dev med, interquartile used in the analysis) A two by two contingency table was used to present the results of the validation study.
The variables True Positive, False Positive, False Negative and True Negative are used to determine the accuracy of the test. The formula to compute the test for accuracy of tourniquet test is shown below. The Receiver Operating Characteristic (ROC) Curves was created by plotting the true positive rate against the false positive rate at various threshold settings. The ROC curve was generated by plotting the cumulative distribution function of the true positive rate in the y – axis versus the cumulative distribution function of the false positive rate in the x – axis. Ethical Consideration: The study was performed in accordance with the Principles in the Declaration of Helsinki. An approval from the Hospital Research and Ethics Committee was obtained before the implementation of this study. A letter to parents/guardians was distributed (Appendix F, G). Informed written consent was sought from the parents/guardians before inclusion of the patient in the study (Appendix H, I). An Assent form was secured for children seven years and above (Appendix J, K). Complete information on the nature, objectives, benefits and risks related to the study was discussed with the parents, and caregiver. Patients who can understand and decide for themselves were oriented of the study. Patients were assured of confidentiality in their participation and results of the test.
RESULT A total of four hundred children, one to 18 years of age participated in this study. Table 1 show that 65.3% (261) are males while 34.8% (139) are females. As shown in table 1, 38.5% (154) of the participants are 5 to 10 years of age, 31.5% (126) are 1 to 5 years of age and 30% (120) are 10 to 18 years of age.
Table 1: Frequency and Percentage Distribution of Participants as to Age and Sex.
our hundred subjects were included in the study, 200 of the subjects were positive for both TT and NS1 antigen. Twenty five subjects were negative for TT but positive for NS1 antigen. There were fifty subjects who were negative for TT and were negative for NS1 antigen. One hundred twenty five subjects were negative for both TT and NS1 antigen. A total of 225 subjects were NS1 positive and 175 subjects were NS1 negative. The subjects who were NS1 negative had other diagnosis such as pneumonia, SVI, AURI and UTI. Table 2 outline the frequency and percentage distribution of the clinical diagnosis other than dengue. It can be seen that those patients who were non dengue mostly suffered from SVI (40%), AURI (30%), pneumonia (20%) and UTI (10%).
Table 2: Frequency and Percentage Distribution of Participants with Diagnosis Other than Dengue
All patients in the study have an admission tourniquet test and were interpreted by the assistant investigator. Blood was extracted and analysed by the hospital registered medical technologist using vitro immune chromatographic test. The result of the tourniquet test is compared with the NS1 antigen in a 2 x 2 contingency table as shown in Table 3. Results showed that two hundred patients with the disease (positive for NS1 antigen) were positive for tourniquet test and twenty five patients with the disease were negative for tourniquet test. In comparison, one hundred twenty five patients without the disease (negative for NS1 antigen) were negative for tourniquet test and fifty patients without the disease were positive for tourniquet test. Table 3: Comparative Data of Tourniquet Test and NS1 antigen in Children with Fever of Five Days or Less in Duration
The accuracy of tourniquet test relative to NS1 antigen was determined through computation of the sensitivity and specificity of the test. Result showed that 88.9% (95% CI 84.04% - 92.68%) of patients with dengue fever/dengue hemorrhagic fever have a positive tourniquet test. In comparison, 71.43% (95% CI 64.12% - 77.99%), of patients without dengue fever/dengue hemorrhagic fever have a negative tourniquet test. The overall accuracy of tourniquet test relative to NS1 antigen is 81.30% (95% CI 77.13 - 84.77%). The estimation of the probability of the presence or absence of the disease was determined through the computation of the positive predictive value and negative predictive value. The probability of having dengue fever/dengue hemorrhagic fever for patients with a positive tourniquet test is 80.0% (95%CI 74.50%- 84.78%). In comparison the probability of not having dengue fever/dengue hemorrhagic fever for patients with a negative tourniquet test is 83.33% (95%CI 76.39% - 88.91%). A useful measure in the interpretation of diagnostic test is the likelihood ratio. The calculated likelihood that a positive tourniquet test is found in patients with, as opposed to a patient without dengue fever/dengue hemorrhagic fever is 3.1 (95% CI2.45 - 3.95). The likelihood that a negative tourniquets test is found in patients with, as opposed to patients without dengue fever/dengue hemorrhagic fever is 0.16 (95%CI 0.11 - 0.23). Table 4 outline the different measures of accuracy of tourniquet test in the diagnosis of Dengue fever/dengue haemorrhagic fever (Appendix L).
Table 4: Summary Statistics of the Measures of Accuracy of Tourniquet Test in the Diagnosis of Dengue Fever/Dengue Haemorrhagic Fever.
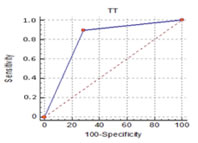
The Receiver Operator Characteristic (ROC) Curve is shown in Figure 2. The performance of the diagnostic test is shown by the solid line. The dashed diagonal line represents a reference of a test with no diagnostic value. At every point along this dashed line, the sensitivity is equal to 1 – specificity. When the sensitivity is equal to 1 – specificity the numerator of the LR+ is equal to one and a positive test results is equally likely for person with and without the disease of interest. A clinically useful diagnostic test like the Tourniquet test will have an ROC curve that is far from this dashed diagonal line. A summary index of overall test performance was calculated as area under the ROC curve. As shown in figure 2 there is a greater area under the ROC curve. The greater the area, the better is the test performance. The resulting area under the curve of 0.804 (p value 0.0001) denotes that tourniquet test in the diagnosis of early stage of dengue infection is significantly predicting the result of NS1 antigen (Appendix M) Figure 2: ROC Curves Comparing the Performance of Tourniquet Test and NS1 antigen for the Diagnosis of Dengue Fever/Dengue Hemorrhagic Fever
In recent decades the incidence of dengue has increased dramatically around the world. The actual numbers of dengue cases are underreported and many cases are misclassified. It is estimated that there are about 390 million dengue infections per year (95% credible interval 284–528 million), of which 96 million (67–136 million) manifest clinically (with any severity of disease).13 A prevalence study of dengue, estimates that 3.9 billion people, in 128 countries, are at risk of infection with dengue viruses.14 The year 2015 was characterized by large dengue outbreaks worldwide, with the Philippines reporting more than 169, 000 cases.15 An early and prompt recognition of dengue fever/dengue hemorrhagic fever is essential for appropriate fluid replacement therapy. The diagnosis of dengue fever/dengue hemorrhagic fever is based primarily on clinical manifestations and serologic test. Nevertheless, serologic test are not readily available especially in remote areas of the country. An accurate, available and affordable diagnostic test for dengue infection is essential. This paper discussed the accuracy of the tourniquet test as a diagnostic test for early stage of dengue infection. An ideal diagnostic test has the potential to completely categorize subjects with and without the disease. Unfortunately such ideal test does not exist in real life. Therefore, a diagnostic test can only make limited distinction between subjects with and without the disease. An ideal test is never positive in a patient who is disease free and is never negative in a patient who is diseased. There are four terms which is fundamental in understanding the utility of clinical test. This are True positive - the patient has the disease and the test is positive; False positive - the patient does not have the disease but the test is positive; True negative: the patient does not have the disease and the test is negative; False negative – the patient has the disease but the test is negative.16 These four terms were used to determine various measures of test accuracy. In this study there were four hundred children with fever of five days or less with common presentation associated with dengue infection. All four hundred children underwent tourniquet test, the index diagnostic test and NS1 antigen, the gold standard used in the diagnosis of dengue infection. The two tests were done at the same time in this group of children with fever of five days or less without knowing who among them have or do not have dengue infection. The test was done simultaneously to confirm or rescind the result of the index test. The Assistant Investigator (Pediatric Resident assigned at the ER) who assessed the result of the tourniquet test was blinded to the result of the NS1 antigen. Similarly, the Assistant Investigator (Certified Medical Technologist) who did the NS1 antigen determination was blinded to the result of the tourniquet test. This strategy was instituted to avoid bias in the result of the index test or gold standard. It is possible that interpreting the result of the tourniquet test while knowing the result of the NS1 antigen test can lead to overestimation of the accuracy of tourniquet test. Blinding for test of accuracy is not so important if the results of the test are objective as in sero- diagnostic test than if results require clinical interpretation. The prevalence of dengue in this study is 56.25%. The result of the present study showed that two hundred children tested positive on both the tourniquet test and the NS1 antigen. One hundred twenty five children tested negative on both tourniquet test and the NS1 antigen test. There were seventy five children with an inaccurate test results. As shown in table 3 there are 225 participants with dengue infection and 175 were free of dengue infection. The diagnostic accuracy of tourniquet test is discussed using various measures. The pre-test probability tells us the possibility of having a target condition before a diagnostic test.17 In this study the pre-test probability of a patient having dengue fever/dengue hemorrhagic fever before the test is run is 0.62. The accuracy of a diagnostic test is reflected in the sensitivity and specificity. It is defined as the test ability to find true positive for dengue infection (sensitivity) or true negative for dengue infection (specificity).17 These measures are independent of the population of interest subjected to the diagnostic test. The sensitivity of a clinical test tells us how well the test identifies children with dengue infection. A highly sensitive test will not miss many children with the disease. The sensitivity of the tourniquet test in this study is 88.89%. This means that 11.11% or 25 children with dengue fever/dengue hemorrhagic fever were falsely identified as not having disease compared to the 88.9% or 200 children who were correctly identified as having dengue fever/dengue hemorrhagic fever. This means that the tourniquet test is good at identifying children with dengue infection. The specificity of a clinical test tells us how well the test identifies children without the disease. A highly specific test will not falsely identify many children as having dengue infection. The tourniquet test has a specificity of 0.71%. This means that 28.57% or 50 children without dengue fever/dengue hemorrhagic fever were falsely identified as having the disease. This means the test is fairly good at identifying children without dengue infection. The sensitivity and specificity are not influenced by the disease prevalence. Thus, the result from one study could easily be transferred to some other setting with a different prevalence of the disease in the population. The tourniquet test as in other diagnostic test has missed dengue infection or indicates dengue infection in normal patients. A false negative and a false positive diagnosis are rarely equally important. Missing dengue fever/dengue hemorrhagic fever will probably regarded by a patient or parent (or his/her doctor) as much more important than a false positive in a well patient. The other concern, is how the test performs in the population being tested and is reflected in the predictive values and likelihood ratios. The predictive value of a test is useful when considering the value of a test to a clinician. The positive predictive value tells us the proportion of children with positive tests that have dengue infection.16 The positive predictive value of a test answers the question: How likely is it that this child has dengue fever/dengue hemorrhagic fever given the result is positive? In our study the positive predictive value is 80%. This means that, of the 250 children who had a positive tourniquet test result, 80% or 200 children have dengue fever/dengue hemorrhagic fever. In comparison the negative predictive value tells us the proportion of children with negative tests that do not have dengue infection.16 The negative predictive value of a test answers the question: How likely is it that this child does not have dengue fever/dengue hemorrhagic fever given that the test result is negative? In the present study the negative predictive value is 83.33%. This means that of the 150 children who had a negative tourniquet test result, 83.33% or 125 have no dengue fever/dengue hemorrhagic fever. Predictive values are dependent on the population being tested and are influenced by the prevalence of the disease.16 Therefore, predictive values from one study should not be transferred to some other setting with a different prevalence of the disease in the population. Positive predictive value and negative predictive value are affected differently by prevalence. The positive predictive value increases, while negative predictive value decreases with the increase of the prevalence of the disease in a population. The likelihood ratio is a very useful measure of diagnostic accuracy. This measure of diagnostic accuracy tells us how many times more likely the tourniquet test result is in subjects with dengue infection than in those without dengue. The likelihood ratio of positive results tells us how well the test performs in the study population. The test is dependent on the accuracy of the test for positive results and the proportion of participants falsely identified as having dengue fever/dengue hemorrhagic fever.16 The likelihood ratio for a positive test in the present study is 3.1. This means that a child with dengue fever/dengue hemorrhagic fever are 3.1 times more likely to have a positive result than a child without dengue fever/dengue hemorrhagic fever. Likelihood ratio for a positive test is the best indicator for ruling in diagnosis. The higher the likelihood ratio for a positive test, the test is more indicative of a disease. The likelihood ratio of negative result tells us how well the test performs in the study population. It is dependent on the accuracy of the test for negative result and the proportion of participants with dengue fever/dengue hemorrhagic fever identified as not having dengue infection.16 The likelihood ratio for a negative test in the present study is 0.16. This means that there is a 0.16 chance that someone with dengue infection will test negative. A likelihood ratio for a negative test is a good indicator for ruling out the diagnosis. The lower the likelihood for a negative test, the test is more indicative of ruling out the disease. The Receiver Operator Curve graph was constructed by plotting the pair of diagnostic sensitivity and specificity value for every individual cut off with the 1 – specificity on the x axis and sensitivity on the y axis. The closer the curve is located to upper left hand corner and the larger the area under the curve the better the test in discriminating between children with dengue infection and without dengue infection. The area under the under curve can have a value between 0 and 1 and is a good indicator of the goodness of the test. The resulting area under the curve of tourniquet test is 0.8. We can say that the relation between Area under the Curve and diagnostic accuracy is very good.
CONCLUSION The tourniquet test is a simple, accurate and readily available diagnostic test for dengue infection. The accuracy of admission tourniquet test is very promising in comparison with NS1 antigen. The admission tourniquet test has a sensitivity of 88.89%. It correctly identified 200 of the 225 patients with dengue infection. The specificity of tourniquet in this study is 71.43%. Fifty of 175 participants without dengue infection were identified to have the disease. The tourniquet test has a positive predictive value of 80.0%. Two hundred of the two hundred fifty participants who have a positive test result have dengue infection. The tourniquet test has a negative predictive value of 83.33%. One hundred twenty five of the one hundred fifty participants who were negative for the test have no dengue infection. The likelihood ratio for positive results of tourniquet test is 3.1. Children with dengue infection are 3.1 times more likely to have a positive tourniquet test than someone without the disease. The Likelihood ratio for a negative test result of tourniquet test is 0.16.
REFERENCES
|
|
|||||||||||||||||||||||||||||||||||||||||||||||||||||||||||||||||||||||||||||||||||||||||||||||||||||||||||||||||||||||||||||||||||||||||||||||||||||||||
 This work is licensed under a Creative Commons Attribution-NonCommercial 4.0 International License.