 Home
Home
|
Table of Content Volume 16 Issue 1 - October 2020
Suchi Jain1, Swastika Suvirya2, Parul Verma3, Narendra Kumar4, Rishi Pal5, A K Sachan6, R Nath7, R K Dixit8
1Junior Resident, 4,5Associate Professor, 6,7,8Professor, Department of Pharmacology and Therapeutics, K.G.M.U, Lucknow, U.P. INDIA. 2Associate Professor, 3Assistant Professor, Department of Dermatology, Venereology and Leprosy, K.G.M.U, Lucknow, U.P. INDIA. Email: jainsuchi22@gmail.com
Abstract Background: Acne is a cosmetic disease with long treatment duration and expenditure. Therefore, this study was performed to evaluate pharmaoeconomic analysis of different acne treatment in northern population. Materials and Methods: It was a prospective observational study for a period of nine months. A total of 60 patients suffering from mild to moderate acne were enrolled and randomly divided into three groups of 20 each categorized as treatment A, treatment B and treatment C. The study tool used were case record form, Dermatology Life Quality Index (DLQI), Cardiff Acne Disability Index (CADI). Results: In a total of 60 acne patients, 1:1 ratio of male to female was observed. Maximum number of patients (50%) fell in the age group 21-30 yrs. Improvement in severity of acne was highest in group B. The minimum cost per unit was observed in treatment A group (rupees 73 for 15 gm). Large cost variation was observed in treatment B (rupees 178.15, with a range 76-254.15). The Mean+SD of total cost of therapy for duration of three months was observed to be lowest for treatment B (526.57+223.32). For reduction in GAGS score the Mean+SD of treatment B was found to be the most effective (20.75+4.36). The Mean+SD scores for Average cost effectiveness ratio (ACER), was found to be lowest for treatment B (28.47+19.76). This ACER analysis reflected treatment B as most cost effective. Incremental cost effectiveness ratio (ICER) of treatment A as compared to treatment B was -1.67 while that of treatment C as compared to treatment B was -202.98. This ICER analysis also reflected treatment B as the most cost effective. Mean (DLQI) score and mean CADI score was lowest in treatment group B at third visit. Conclusion: Pharmacoeconomic analysis helps to find disease treatment that is cost economical and equally effective. Keywords: Acne, Pharmacoeconomic analysis, ACER, ICER, GAGS, DLQI, CADI
INTRODUCTION Acne vulgaris is a disease of the pilosebaceous unit which involves chronic inflammation. It is the most common skin disease considered to occur during the lifetime of individuals. It has been stated that some degree of acne is experienced by 90% of individuals between puberty to 30 years of age1. Skin plays pivotal role in socialization. Acne results in cosmetic disfigurement that can result in social disapproval, psychological disturbances, emotional stress and frustration. Previous studies had reported 0.38-8% prevalence of acne vulgaris in India (different studies by adityan, valia, khunger)2. There are estimated 200-300 million sufferers in the country. The socioeconomic relevance is based not only on its prevalence but also on its cost that includes direct as well as indirect cost. Therefore knowledge of therapeutic costs as well as economic benefit of the acne treatment both are equally important. This is analysed under an entity known as Pharmacoeconomics which has been defined as the analysis and description of costs of drug therapy available to the health care systems and society. It engages in identifying, measuring and comparing the pharmaceutical products and services costs and consequences. These methods can be used by clinicians and other decision makers to do evaluation and comparison of the total costs of treatment options and the outcomes. There are four basic types of pharmacoeconomic studies3: Cost-minimization analysis (CMA), Cost-effectiveness analysis (CEA), Cost-utility analysis (CUA), and Cost-benefit analysis (CBA). The primary objective of the study was to perform a Cost Minimization Analysis and Cost Effective Analysis of different therapeutic regimens prescribed and the secondary objective was to describe demographic details and assessment of Quality of Life (QoL) in patients of acne coming to Out Patient Department of Dermatology, Venereology and Leprosy, K.G.M.U, Lucknow.
MATERIALS AND METHODS The present research work was conducted at Department of Pharmacology and Therapeutics in collaboration with Department of Dermatology, Venereology and Leprosy, King George’s Medical University, Lucknow. It was a prospective observational study to perform pharmacoeconomic analysis of different therapeutic regimens prescribed to acne patients coming to OPD of Dermatology, Venereology and Leprosy, King George’s Medical University, Lucknow. It was started only after the approval of Institutional Ethics Committee, King George’s Medical University, Lucknow (Reference code: 93rd ECM II B- Thesis / P 25) for a period of nine months from December 2018 – August 2019. Newly diagnosed patients with acne and satisfying inclusion criteria were enrolled only after taken written informed consent. These patients were interviewed for their demographic profile, disease status and data on prescribed drug was collected and the cost of treatment was evaluated to study the pharmacoeconomics of acne treatment which included cost minimization analysis and cost effectiveness analysis and along with this quality of life was assessed. On the first visit, a Case Record From (CRF) designed as per the study protocol was filled according to the prescription of the patient (which included patient demographic details, severity of acne, therapeutic regimen prescribed, investigation reports, direct and indirect costs). Acne severity assessment was done in accordance with the global acne grading system4 and recorded for outcome measure comparison. The same process was repeated at follow up visits (1st month, 3rd month from 1st visit) where patients were assessed for clinical improvement. These different therapeutic regimens prescribed to patients suffering from mild to moderate acne were considered - A. Topical Clindamycin, B. Topical Clindamycin plus Topical Adapalene, C. Topical Adapalene plus Topical Benzoyl Peroxide (Above mentioned drugs are approved by Central Drugs Standard Control Organization [CDSCO] and Drug Controller General of India [DCGI] for acne treatment). For cost minimization analysis – The different therapeutic regimens (A / B / C) were compared for lowest cost. For cost effectiveness analysis – The different therapeutic regimens (A / B / C) were compared for superior efficacy. The outcome was measured in accordance with Global acne grading system. The quality of life in acne patients was assessed by Dermatology Life Quality Index (DLQI) [5] and acne specific health related QoL i.e. Cardiff Acne Disability Index (CADI)6. The economic data was obtained from the relevant sources, patient and when required, patient caretakers. The pharmacoeconomic analysis for mild to moderate acne treatment was done. Data obtained from the case record form and recording of the various clinical parameters after been collected were analysed. Data was entered in the Microsoft word excel sheet and analysed. The statistical analysis was done using SPSS Version 21.0 statistical Analysis Software. The values were represented in Number (%) and Mean±SD. P values less than 0.05 was considered as statistically significant. (a) Cost minimization analysis: Comparison of cost of different therapeutic regimens (b) Cost effective analysis: Comparison of cost and benefit outcomes, Incremental Cost Effective Ratio (ICER), Average Cost Effectiveness Ratio (ACER).
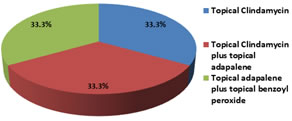
RESULTS A total of 60 patients suffering from mild to moderate acne were enrolled and randomly divided into three groups of 20 each on the basis of therapeutic regimen prescribed. The different therapeutic regimens considered for this study were categorized as treatment A, treatment B and treatment C. These treatments included: A - Topical Clindamycin (1%), B - Topical Clindamycin (1%) plus Topical Adapalene (0.1%), C - Topical Adapalene (1%) plus Topical Benzoyl Peroxide (2.5%). Thus, out of 60 patients, 20 (33.3%) were prescribed topical clindamycin (1%) were classified as treatment A, 20 (33.3%) prescribed topical clindamycin (1%) plus topical adapalene (0.1%) were classified as treatment B and rest 20 (33.3%) prescribed topical adapalene (0.1%) plus topical benzoyl peroxide (2.5%) were classified as treatment C. (Table 1, Figure 1). Table 1: Distribution of acne study population according to treatment prescribed (N=60)
Figure 1: Distribution of acne study population according to treatment prescribed (N=60)
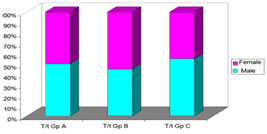
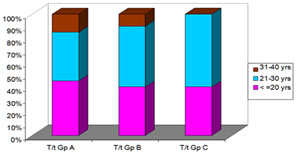
Demographic Characteristics In a total of 60 acne patients, the total number of males was 50% (30/60) while rest 50% (30/60) were females. Among patients prescribed treatment A, 50% (10/20) were males and rest 50% (10/20) females, patients prescribed treatment B, 45% (9/20) were males and 55% (11/20) were females, patients prescribed treatment C, 55% (11/20) were males and 45% (9/20) were females. Patients prescribed different treatments were comparable genderwise (Table 2, Figure 2). The age group ranged from 18 years to 40 years. Out of 60 patients, the maximum number of cases fall in the age group of 21-30 yrs (50%, 30/60) followed by ≤20 yrs (41.7%, 25/60) and rest (8.3%, 5/60) in the age group 31 – 40 yrs. We observed majority of the patients were aged ≤30 years of age (91.7%, 55/60), rest 5 (8.3%) patients were aged 31-40 years. Age of patients prescribed different treatments were found to be comparable. ( Table 3, Figure 3)
Table 2: Distribution of acne study population according to gender and treatment prescribed (N=60)
c²=0.4 (df=2); p=0.819 Figure 2: Distribution of acne study population according to gender and treatment prescribed (N=60) [T/t=Treatment; Gp=Group]
Table 3: Distribution of acne study population according to age group and treatment prescribed (N=60)
c²=3.680 (df=4); p=0.451 Figure 3: Distribution of acne study population according to age group and treatment prescribed (N=60) [T/t=Treatment; Gp=Group]
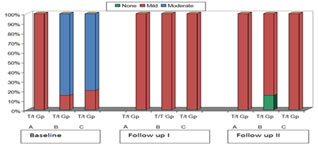
Acne severity based on global acne grading system (GAGS) Acne severity was assessed using score based on Global acne grading system. At the baseline (first visit) all the patients of treatment A group had mild level of severity while 85.0% and 80.0% of the patients of treatment B and treatment C respectively had moderate level of severity. This difference was found to be significant statistically. At first follow up (first month from baseline / second visit) all the patients in treatment B and C group showed change of severity from moderate to mild. Though the level of severity found in treatment A group was the same but decrease in the indivisual score was observed. At second follow up (third month from baseline / third visit) change of severity from mild to none was observed in 15.0% patients prescribed treatment B and rest of the patients showed mild level of severity but with decrease in their indivisual score. This difference was found to be statistically significant. [ Table 4(a), Figure 4(a) ]
Table 4 (a): Intergroup comparison of different acne treatments based on global acne grading score
Figure 4 (a): Intergroup comparison of different acne treatments based on global acne grading score [T/t=Treatment; Gp=Group]
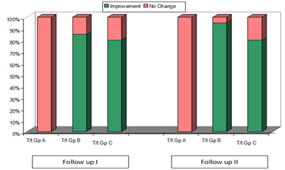
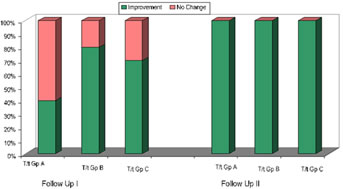
Change in severity of acne based on GAGS score (Improvement at follow up) We observed no change in severity of acne among patients prescribed treatment A either at follow up 1 and at end of study (Follow up 2), but there was improvement in indivisual GAGS score. While among patients prescribed treatment B and treatment C, a statistically significant improvement in severity of acne was observed. Improvement in severity of acne was higher in treatment B group as compared to treatment C group at both the visits. [ Table 4 (b), Figure 4 (b)]
Table 4 (b): Change in severity of acne based on GAGS
Figure 4 (b): Change in severity of acne based on GAGS [T/t=Treatment; Gp=Group]
Between groups comparison of prescribed treatments at different follow up based on GAGS score (Mann Whitney U test) Baseline differences in severity of acne (GAGS score) between the treatments were found to be significant when compared to treatment A. At first follow up, severity of acne was found to be similar among patients prescribed different treatments (A, B and C). At end of the study too, difference in severity of acne was found to be comparable between the groups.[ Table 4 (c) ]
Table 4 (c): Between groups comparison at different follow up based on GAGS score
Cost Minimization Analysis The cost range observed in treatment A was rupees (73 – 187), treatment B was rupees (76 – 254.15) and treatment C was rupees (352.5 – 459.3). The minimum cost per unit in treatment A (rupees 73 for 15 gm) and treatment B (rupees 76 for 15 gm) was comparable where as in treatment C (rupees 352.5 for 15 gm) was found significantly high compared to treatment A and treatment B. Large cost variation was observed in treatment B (rupees 178.15). Cost Variation observed in treatment A (rupees 114) and treatment C (rupees 106.8) were comparable. Percent cost variation observed in treatment A, treatment B and treatment C was 156.2, 234.4 and 30.29 respectively. It was significant in treatment group B and C but insignificant in treatment group C. Treatment B showed highest percent cost variation. [ Table 5 (a), 5 (b), 5 (c), 5 (d) ] Table 5 (a): Cost analysis in treatment A
(*Treatment A: Topical Clindamycin 1%)
Table 5 (b): Cost analysis in treatment B
( **Treatment B: Topical Clindamycin 1%, Topical Adapalene 0.1%)
Table 5 (c): Cost analysis in treatment C
(***Treatment C: Topical Adapalene 0.1%, Topical Benzoyl Peroxide 2.5%)
Table 5 (d): Different acne treatment groups cost compared
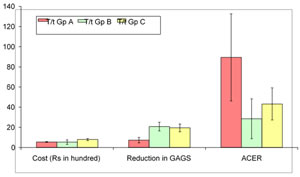
Cost Effectiveness analysis Average cost effectiveness ratio analysis (ACER) The Mean+SD of total cost of therapy was observed to be lowest for treatment B (526.57+223.32), followed by treatment A (549.00+36.94) and highest for treatment C (790.44+107.36). The difference among the means of total cost of therapies was found to be statistically significant. Similarly, for reduction in GAGS score the Mean+SD of treatment B was found to be the most effective (20.75+4.36) followed by treatment C (19.45+3.85). The Mean+SD of treatment A for GAGS reduction was found to be the least (7.30+2.70). This difference was also found statistically significant. The Mean+SD scores for Average cost effectiveness ratio (ACER), was found to be lowest for treatment B (28.47+19.76). This difference between the therapies was found to be significant. [Table 6 (a), Figure 6 (a) ]
Table 6 (a): Intergroup Comparison of Cost and Cost Effectiveness
Figure 6 (a): Intergroup Comparison of Cost and Cost Effectiveness [T/t=Treatment; Gp=Group] Between Group Comparison of Cost and Cost Effectiveness Treatment groups A, B and C were compared with each other for cost, reduction in GAGS and ACER. Cost differences in therapies were found to be significant when compared to treatment C. Reduction in GAGS, between therapies was found to be significant when compared to treatment A. Similarly, difference in ACER was found to be significant when compared to treatment A [ Table 6 (b) ]
Table 6 (b): Between Group Comparison of Cost and Cost Effectiveness (Tukey HSD test)
Incremental cost effectiveness ratio analysis (ICER) Average cost of therapy for three months treatment was found to be minimum for treatment B (Rs 526.57) followed by that of treatment A (Rs 549.00) while average cost of treatment C was maximum (Rs 790.44). The mean reduction in GAGS was maximum for treatment B (20.75) followed by for treatment C (19.45) and least for treatment A (7.30). Incremental cost of treatment A as compared to treatment B was Rs 22.44 while that of treatment C as compared to treatment B was Rs 268.33. Incremental effect of treatment A as compared to treatment B was 13.45 and that of treatment C as compared to treatment B was 1.3. ICER ( Increment in cost / Increment in effect) of treatment A as compared to treatment B was -1.67 while that of treatment C as compared to treatment B was -202.98. (Table 7)
Table 7: Incremental cost effectiveness ratio analysis (ICER) of the three acne treatments (A/B/C)
*IC – Incremental cost, **IE – Incremental Effect
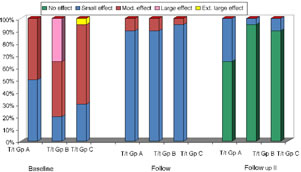
Quality of Life Dermatology Quality of Life Index (DLQI) At baseline, patients in treatment A group had equal distribution for small or moderate effects (50% vs. 50%) based on DLQI while majority of the patients in treatment B and treatment C had moderate to extremely large effects of DLQI score (80.0% and 70.0% respectively). This difference was found to be significant statistically. At first follow up visit, majority of the patients irrespective of therapy had small effect of DLQI score. 95% of patients prescribed treatment C had small effect while 90% each of patients prescribed treatment A and treatment B had small effects for DLQI, rest of the patients had moderate DLQI. Dermatology life quality index of patients prescribed different treatments was found to be comparable. At second follow up visit (End of study), no effect was observed in significantly higher proportion of patients prescribed treatment B and treatment C (95% and 90% respectively) as compared to those prescribed treatment A (65%), rest of the patients had only small effect. [ Table 8 (a), Figure 8 (a) ]
Table 7 (a): Intergroup comparison of quality of life on DLQI score
Table 8 (a): Intergroup comparison of quality of life on DLQI score
Change in QoL of acne patients based on DLQI A statistically significant improvement in DLQI was observed among all the patients irrespective of the therapy for both Follow up 1 (Visit 1) and Follow up 2 (Visit 2). Improvement in DLQI was highest in treatment B followed by treatment
Table 8 (b): Change in QoL of acne patients based on DLQI
Figure 8 (b): Change in QoL of acne patients based on DLQI [T/t=Treatment; Gp=Group]
Between groups comparison at different follow up based on DLQI score Baseline differences in DLQI score between the therapies were found to be significant only between treatment A and treatment B. At first follow up, DLQI was found to be comparable between the treatments. At end of the study too, difference in DLQI was found comparable between the groups.[ Table 8 (c) ]
Table 8 (c): Between groups comparison at different follow up based on DLQI score (Mann Whitney U test)
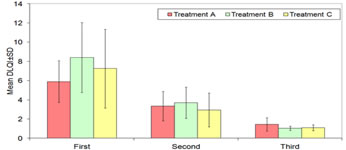
Comparison of means of DLQI scores among treatment groups No significant difference in mean scores of patients in three groups was observed at first and second visits (p>0.05). However, at third visit, mean scores in group A were significantly higher as compared to that in groups B and C (p<0.05). [ Table 8 (d), Figure 8 (d), Table 8 (e) ]
Table 8 (d): Comparison of DLQI scores among study groups at different follow-up periods
Table 8 (d): Comparison of DLQI scores among study groups at different follow-up periods
Table 8 (e): Post-hoc Tukey HSD test for between group differences at third follow-up
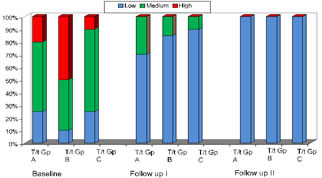
Cardiff Acne Disability Index (CADI) At baseline, higher proportion of patients in treatment A and treatment C group showed medium CADI grade (55.0% and 65.0% respectively) as compared to treatment B group (40.0%). Higher proportion of patients with high CADI grade were observed in treatment C (50.0%) group as compared to treatment A and treatment B groups (20.0% and 10.0% respectively). Difference in CADI grade was found to be significant statistically. At first follow up visit, majority of the patients irrespective of therapy had low disability, rest of the patients had medium level of disability. Maximum (90%) patients in treatment C group had low disability, followed by treatment B (85%) and treatment A (70%) groups. At second follow up visit (End of study), all the patients irrespective of the treatment used had low disability. [ Table 10 (a), Figure 10 (a)]
Table 10 (a): Intergroup comparison of quality of life on CADI score
Figure 10 (a): Intergroup comparison of quality of life based on CADI score [T/t=Treatment; Gp=Group] Change in QoL in acne patients based on CADI score A statistically significant improvement in acne disability (CADI) was observed among all the patients irrespective of the therapy for both Follow up 1 (Visit 1) and Follow up 2 (Visit 2).Improvement in acne disability was highest in treatment B followed by treatment C for both the visits.[ Table 10 (b), Figure 10 (b) ]
Table 10 (b): Change in QoL in acne patients based on CADI
Folow Up II Follow Up I 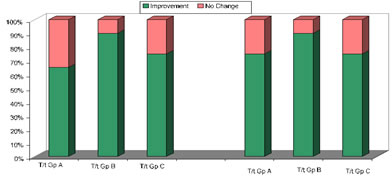 Figure 10 (b): Change in QoL in acne patients based on CADI score [T/t=Treatment; Gp=Group]
Between groups comparison of treatments used at different follow up based on CADI score Baseline differences in CADI score (acne disability) between the treatment groups were found to be significant only between treatment B and treatment C. At follow up visit 1, acne disability was found to be comparable between the groups. At end of study, acne disability was found to be similar among patients assigned to different therapies. [ Table 10 (c) ]
Table 10 (c): Between groups comparison at different follow up based on CADI score (Mann Whitney U test)
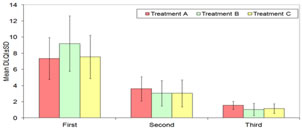
Comparison of means of CADI scores among treatment groups No significant difference in mean scores of patients in three groups was observed at first and second visits (p>0.05). However, at third visit, mean scores in Group B were significantly lower as compared to that in Groups A and C (p<0.05).[ Table 10 (d), Figure 10 (d) ]
Table 10 (d): Comparison of CADI Scores among study groups at different follow-up periods
Figure 10 (d): Comparison of CADI Scores among study groups at different follow-up periods
Table 10 (e): Post-hoc Tukey HSD test for Between Group differences at third follow-up
DISCUSSION A total of 60 acne patients were recruited. Three acne treatment groups were considered. Each group consisted of 20 patients. Treatment group A was prescribed topical clindamycin (1%), treatment group B was prescribed topical clindamycin (1%) plus topical adapalene (0.1%) and treatment group C was prescribed topical adapalene (1%) plus topical benzoyl peroxide (2.5%). Demographic Characteristics Gender wise distribution of 60 acne patients studied, we observed males and females in ratio of 1:1. As per the treatment groups are concerned, in treatment group A, equal number of males and females were reported, in treatment group B 45% were males while rest 15% were females, in treatment group C, 55% were males while 45% were females. Study conducted by Durai PT and Nair DG 7 and Saxena K et al.8 reported female to male ratio of 1.55:1 and 1.44:1 in their studies repectively. Adityan B and Thappa DM 9 and Pandey P et al. 10 reported male to female ratio of 1.25:1 and 1.04:1 in their studies respectively. These previous reports are comparable to finding observed in our study. Age wise distribution reported maximum number of patients (50%) in the age group 21-30 yrs followed by 41.7% in the age group ≤20 yrs. The range of age group studied was above 18 yrs to 40 yrs. Overall, 91.7% patients were aged ≤30 yrs as literature showed acne is more common among adolescent and young adults. Durai PT and Nair DG 7 reported 21.46 ± 2.814 years as mean age ranging from 18-30 yrs. Adityan B and Thappa DM 9 recorded 16 to 20 yrs (59.8%) as the most common age group. These findings are in sync with the finding reported in our study. Acne severity based on global acne grading system (GAGS) We observed out of total 60 acne patients reported 27 were of mild severity where as 33 presented with moderate severity assessed using GAGS at baseline (first visit, pre-treatment). In treatment group A all the 20 acne patients showed mild grade of severity. In treatment group B, out of 20 acne reported, 17 were moderate while 3 were with mild severity. In treatment group C, out of 20 acne observed, 16 were of moderate while 4 were of mild severity. At first follow up, all the patients in each treatment group showed mild severity. At second follow up, 3 patients in treatment group B showed change of severity from mild to none. Improvement in severity of acne was higher in treatment B group as compared to treatment C group at both the visits. Inter group comparison showed at first follow up, severity of acne was found to be similar among patients prescribed different treatments (A, B and C). At end of the study too, difference in severity of acne was found to be comparable between the groups. Cost Minimization Analysis On cost minimization analysis of the three acne treatment, we observed the minimum cost per unit in treatment A (rupees 73 for 15 gm), treatment B (rupees 76 for 15 gm) and in treatment C (rupees 352.5 for 15 gm). The value was found significantly high in treatment C compared to treatment A and treatment B. Large cost variation was observed in treatment B (rupees 178.15). Cost Variation observed in treatment A (rupees 114) and treatment C (rupees 106.8) were comparable. Percent cost variation observed in treatment A, treatment B and treatment C was 156.2, 234.4 and 30.29 respectively. It was significant in treatment B and C but insignificant in treatment C. Treatment B showed highest percent cost variation. It was observed that alternate products of same formulation prescribed in treatment B group showed a significantly high percent cost variation followed by treatment C. Cost Effectiveness analysis Average cost effectiveness ratio analysis (ACER) The total cost of the therapy was evaluate for a period of 3 months and the mean was calculated. The lowest total cost of therapy (Mean+SD) observed with treatment B was (526.57+223.32), followed by treatment A (549.00+36.94) and was highest for treatment C (790.44+107.36). To observe treatment effectiveness, GAGS was considered as the efficacy parameter and reduction in GAGS was calculated for each treatment where treatment B was found to be the most effective with reduction in GAGS as (20.75+4.36) followed by treatment C (19.45+3.85). The reduction in GAGS was found to be the least (7.30+2.70) with treatment A. On comparing the ACER of the three treatments, treatment B was found with lowest ACER which indicates that treatment B was most cost effective. Between group comparison showed cost differences in therapies were significant when compared to treatment C, reduction in GAGS between therapies and difference in ACER were significant when compared to treatment A. Incremental cost effectiveness ratio analysis (ICER) We observed that average cost of therapy for three months treatment was found to be minimum for treatment B (Rs 526.57) followed by that of treatment A (Rs 549.00) while average cost of treatment C was maximum (Rs 790.44). The mean reduction in GAGS was maximum for treatment B (20.75) followed by treatment C (19.45) and least for treatment A (7.30). Incremental cost of treatment A as compared to treatment B was Rs 22.44 while that of treatment C as compared to treatment B was Rs 268.33. Incremental effect of treatment A as compared to treatment B was 13.45 and that of treatment C as compared to treatment B was 1.3. ICER (Increment in cost / Increment in effect) of treatment A as compared to treatment B was -1.67 while that of treatment C as compared to treatment B was -202.98. These observations describes treatment B [topical clindamycin (1%) plus topical adapalene (0.1%)] as most cost effective in comparison to treatment C [topical adapalene (0.1%) plus topical benzoyl peroxide (2.5%)] and treatment A [topical clindamycin (1%)]. Prasad S et al. 11 reported efficacy and safety of gel formulation of adapalene 0.1% and clindamycin 1% in their study of clinical trial. Wolf JE et al. [12] in their randomized trial reported [topical clindamycin (1%) plus topical adapalene (0.1%)] efficacious in comparison to clindamycin plus vehicle for mild to moderate acne treatment. Pickett H and Wiltz S [13] reported [topical adapalene (0.1%) plus topical benzoyl peroxide (2.5%)] similarly effective to other combinations for acne treatment. Codi S and Nakhwa Y [14] demonstrated comparable efficacy of [topical clindamycin (1%) plus topical adapalene (0.1%)] with [topical adapalene (0.1%) plus topical benzoyl peroxide (2.5%)] but slightly higher irritation with adapalene benzoyl peroxide group.In our study also, we observed combinations better than clindamycin in terms of efficacy assessed through GAGS and between two combinations used, both were found effective but on cost analysis, treatment clindamycin adaplaene was better alternative. Quality of Life Dermatology Quality of Life Index (DLQI) Quality of Life was assessed using DLQI score at baseline (pre-treatment), follow up I and follow up II and was compared between the groups. At baseline, patients in treatment A group had equal distribution for small or moderate effects (50% vs. 50%) based on DLQI while majority of the patients in treatment B and treatment C had moderate to extremely large effects of DLQI score (80.0% and 70.0% respectively). The difference was found to be statistically significant. At first follow up visit, majority of the patients irrespective of therapy had small effect of DLQI score. At second follow up visit (End of study), no effect was observed in significantly higher proportion of patients prescribed treatment B and treatment C (95% and 90% respectively) as compared to those prescribed treatment A (65%), rest of the patients had only small effect which indicates the effectiveness of treatment B and C over treatment A. Improvement in DLQI was highest in treatment B followed by treatment C at first visit while all the patients irrespective of the treatment used showed improvement for the second visit. Comparison between groups at first follow up and end of study was found comparable. On comparing means DLQI score, a high mean DLQI score was observed at baseline in each treatment groups - A, B, C (5.9, 8.4, 7.25) respectively. At third visit mean DLQI score found was lowered in all the three groups but were significantly higher in treatment group A to that in group B and C. This indicates that treatment B was most effective in improving QoL in acne patients. Durai PT and Nair DG 7, Hazarika N and Rajaprabha RK 15 Yuwnate AH et al. 16 reported mean DLQI score of 6.91, 7.22 and 7.17 in their studies respectively. These previous reports are in parallel agreement with the finding in our study. Cardiff Acne Disability Index (CADI) Specific acne related score, Cardiff acne disability index was also used to assess quality of life in acne patients. It was assessed at baseline (pre-treatment), follow I and follow up II and was compared between the groups. At baseline, higher proportion of patients in treatment A and treatment C group showed medium CADI grade (55.0% and 65.0% respectively) as compared to treatment B group (40.0%). Higher proportion of patients with high CADI grade were observed in treatment C (50.0%) group as compared to treatment A and treatment B groups (20.0% and 10.0% respectively). Difference in CADI grade was found to be significant statistically. At first follow up visit, majority of the patients irrespective of therapy had low disability, rest of the patients had medium level of disability. Maximum (90%) patients in treatment C group had low disability, followed by treatment B (85%) and treatment A (70%) groups. At second follow up visit (End of study), all the patients irrespective of the treatment used had low disability. Improvement in acne disability was highest in treatment B followed by treatment C for both the visits. Baseline differences in CADI score (acne disability) between the treatment groups were found to be significant only between treatment B and treatment C. At follow up visit 1, acne disability was found to be comparable between the groups. At end of study, acne disability was found to be similar among patients assigned to different therapies. On comparing means CADI score, a high mean CADI score was observed at baseline in each treatment groups - A, B, C (7.35, 9.20, 7.55) respectively. At third visit mean CADI score found was lowered in all the three groups but were significantly lower in treatment group B to that in group A and C. This indicates that treatment B was most effective in improving QoL in acne patients. Durai PT and Nair DG 67, Gupta A et al. 145 reported mean CADI score of 5.2 and 6.09 in their studies respectively. We reported higher values in comparison to these studies.
CONCLUSION For the second part of our study, we can conclude that acne a cosmetic disease associated with social stigma, especially in younger age group and also requires longer duration of treatment which adds to economic burden, there needs to be therapy which is easily available, accessible and affordable to population at a large. Cost minimization analysis and cost effectiveness analysis are two methods of pharmacoeconomic analysis that helps to analyze treatment with least cost and better effectivity. Limitation Smaller sample size and study duration were one of the major limitations. Literature search showed very few studies in this regard, therefore, lack of evidence-based data and direct comparator studies added to the limitation.
REFERENCES
|
|
||||||||||||||||||||||||||||||||||||||||||||||||||||||||||||||||||||||||||||||||||||||||||||||||||||||||||||||||||||||||||||||||||||||||||||||||||||||||||||||||||||||||||||||||||||||||||||||||||||||||||||||||||||||||||||||||||||||||||||||||||||||||||||||||||||||||||||||||||||||||||||||||||||||||||||||||||||||||||||||||||||||||||||||||||||||||||||||||||||||||||||||||||||||||||||||||||||||||||||||||||||||||||||||||||||||||||||||||||||||||||||||||||||||||||||||||||||||||||||||||||||||||||||||||||||||||||||||||||||||||||||||||||||||||||||||||||||||||||||||||||||||||||||||||||||||||||||||||||||||||||||||||||||||||||||||||||||||||||||||||||||||||||||||||||||||||||||||||||||||||||||||||||||||||||||||||||||||||||||||||||||||||||||||||||||||||||||||||||||||||||||||||||||||||||||||||||||||||||||||||||||||||||||||||||||||||||||||||||||||||||||||||||||||||||||||||||||||||||||||||||||||||||||||||||||||||||||||||||||||||||||||||||||||||||||||||||||||||||||||||||||||||||||||||||||||||||||||||||||||
 This work is licensed under a Creative Commons Attribution-NonCommercial 4.0 International License.