 Home
HomeOfficial Journals By StatPerson Publication
|
Table of Content - Volume 11 Issue 2 -August 2019
Study of rate of cooling and warming at different sites of the body following extracorporeal cooling and rewarming in patients during open heart surgery
Anshu SS Kotia1, Jaswant Goyal2*, Saloni Chandalia3, Barkha Goyal4, Rashmi Attri5, Nirmal Sen6
{1,2Assistant Professor, Department of Anaesthesiology} 3Counselor Resident {4Tutor, Department of Biochemistry} 5Clinical Research Coordinator, Jaipur National University Institute for Medical Sciences and Research Centre, Jagatpura, Jaipur, INDIA. 6Ex-Professor, Department of Anaesthesiology, Sawai Man Singh Hospital and Medical College, Jaipur, Rajasthan, INDIA. Email:health@jnuhealthcare.com
Abstract Background: Temperature management during cardiac surgery has been one of the chief concerns. Numerous strategies are currently invoked to manage the requirements of cooling, temperature maintenance, and rewarming patients during cardiac surgical procedures.Aim: To study the rate of cooling and warming at different sites of the body following extracorporeal cooling and rewarming in patients during open heart surgery.Materials and Method: The present study was conducted on fifty patients undergoing elective open heart surgery at Tertiary Care Hospital in Jaipur city. Fifty patients belonging to both sex and different age groups were studied. The patients were divided into two groups. Group I consisting of patients in which Nitroglycerin was not used as vasodilator during rewarming on Cardiopulmonary bypass and Group II where Nitroglycerin was used.Results: During bypass stage, the Skin, Rectal and Nasopharyngeal temperatures fell because of hypothermia. In both groups the rectal temperature fell slowly. The fall in skin temperature was maximum whereas nasopharyngeal temperature showed an intermediate fall.Conclusion: The temperature of heart determines the degree of protection afforded to it during coronary occlusion by aortic cross clamping. Key Word:extracorporeal cooling, rewarming.
INTRODUCTION Regulation of body temperature is attributed to the hypothalamus. This regulates temperature by controlling the rates of heat production and heat loss. Loss of heat from the body occurs by radiation, convection, conduction and in warm temperature, by evaporation. The internal temperature of the body – the core temperature is, however, very accurately regulated by self actuated mechanisms, at around 37◦C.This represents the balance between heat loss and heat production in the body. Heat production is a reflection of the metabolic rate. The factors which influence it include the basal metabolic rate, sympathetic activity and increased body temperature itself, which causes increase in heat production by the cells. During hypothermia, body temperature is reduced below its normal value, so that therapeutic use can be made of the concomitant reduction in metabolic rate. In cardiac surgery, hypothermia is used to reduce the metabolic demands so that interrupted or inadequate perfusion may be better tolerated, in terms of oxygenation, by vital organs. The rate of fall of temperature is expected to vary when cooling is affected by surface methods in contrast to vascular cooling. Gradients in temperature could be wider following rapid vascular cooling of the body. Since the blood flow through the different layers of the body may not be uniform, hence the recordings of temperature from different parts was done to assess the general heat loss or heat gain from the body during such rapid cooling or rewarming by the blood stream. Therefore, it is essential to study the pattern of temperature fall or rise at different parts of the body, before accepting the relevance of isolated recordings. In the past, various sites have been suggested for the serial recording of temperature. The heart and brain temperatures are primary concern. Yang et al. (2017) observed that esophageal temperature detected via thermal probe located at the distal esophagus could better indicate the brain temperature at the time of inducing cooling and maintenance of target mild hypothermia. Regardless of regional or whole-body cooling, esophageal temperature measurement has a great potential as a priority method for TTM (Target Temperature Management).Peripheral temperature gave an early indication of low cardiac output status. Use of peripheral temperature and core to peripheral skin temperature gradient has been used as a guide to assess circulatory status in clinical practice. (Butt and Shawn, 1991; Pezawas, Rajekand Plochl, 2007). The present study was undertaken with a view to determine the rate of cooling and warming at different sites of the body following extracorporeal cooling and rewarming in patients during open heart surgery. During extracorporeal circulation, it is important that body temperature be brought down uniformly to the same level during cooling, and restored in all regions equally during rewarming. Failure to do so may lead to gross fluctuations in temperature, disturbing metabolic functions and oxygen utilization. It therefore becomes mandatory, that temperature measurements be made from different sites of the body, such as the nasopharynx, rectum, oesophagus and skin.
AIMS AND OBJECTIVES
METHODOLOGY The present study was conducted on fifty patients undergoing elective open heart surgery at SMS Medical College and Hospital, Jaipur. Patients of both sex and different age groups were studied. No patient with chest infection, renal or hepatic disease was included. All the patients were thoroughly assessed preoperatively. Detailed history of illness as well as drug therapy was taken. A thorough physical examination and evaluation of various investigations was done. Patients were explained about various procedures including monitoring, post operative ventilation and physiotherapy. Written consent for surgery under anaesthesia was taken. Premedication diazepam 5-10 mg H.S. and injection buprenorphin 4 ug/kg/IM one hour prior to surgery. Conduct of Anaesthesia: After putting peripheral, arterial central venous lines, patients were continuously monitored on a cardiac monitor (Lohmeier) for various parameters. Pre oxygenation through face mask was given for 5 minutes. Then injection diazepam 0.1 mg/kg I.V. slowly in central venous line and injection norphine 0.06 mg/kg IV were given followed by priming doses of non-depolarizing muscle relaxant. Then, slow intravenous injection of thiopentone (4 mg/kg body weight) was given followed by remaining calculated dose of non-depolarizing muscle relaxant like atracurium (0.5 mg/kg) or pancuronium/vecuronium (0.08 to 0.1 mg/kg body weight) intravenously. On relaxation endotracheal intubation was done. Throughout this period, ventilation was controlled using a face mask. All vital parameters were continuously monitored. An insulated nasopharyngeal temperature probe of yellow spring instruments was put through the patient nostril for direct core temperature measurement. RESULTS The present study was undertaken in the department of Anesthesiology, SMS Medical College and Hospital, Jaipur. Fifty patients belonging to both sex and different age groups were studied. The patients were divided into two groups. Group I consisting of patients in which Nitroglycerin was not used as vasodilator during rewarming on Cardiopulmonary bypass and Group II where Nitroglycerin was used. Protocol of anesthesia and bypass procedure was kept similar in all patients. Vital parameters like heart rate and blood pressure were recorded at regular intervals. Temperature recordings were made at fixed time intervals. The p values for statistical significance were derived by applying various formulae of student t test. The following observations and results were drawn from the study. In the study 31 patients (62%) were males while 19 patients (38%) were females. The various surgical procedures performed are shown in the below table. Maximum number of patients (50%) had mitral valve replacement and 30% had correction of congenital conditions.
Table 1:
Among fifty patient studied, 34 patients underwent valvular surgery while 16 patients had avalvular operation. The rewarming time ranged from 11 to 50 minutes. The rewarming was faster in patients in group II where nitroglycerin was administered. Comparison of Total Bypass Time, AOXCL (Aortal Cross Clamp) Time and Rewarming Time in the two groups
Table 2:
This table shows the comparison of total bypass time, aortic cross clamping time and rewarming time in the two groups. The total bypass time had a mean value of 76.24 minutes in Group I while it was 83.61 minutes in Group II. The total aortic cross clamp time was 52.51 minutes (Mean) in Group I and 62.65 minutes in Group II. The rewarming times were nearly equal in both the groups with mean of 32.0 minutes in group I and 31.45 minutes in group II. Table 3:
Group II patients required higher pump flows for the circulation of Nitroglycerin during rewarming on bypass.
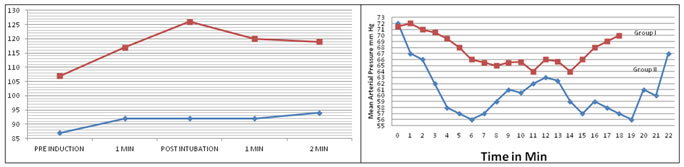
Figure 1:Changes in Mean Heart Rate Figure 2:Mean Arterial Pressure This graph shows the mean heart rate in both the groups in the pre-induction and the post-induction phases. There was higher increase in heart rate in group II after endotracheal intubation.Also, there was a fall in mean blood pressure after induction. The rise in mean arterial pressure after endotracheal intubation was not significant because of attenuation of laryngo-endotracheal reflex. This graph depicts mean arterial pressure during the rewarming; the mean arterial pressure was similar in both the groups. In group I patients, where Nitroglycerin was not used as a vasodilator during rewarming phase, spike like fluctuations were seen in mean arterial pressure. Whereas in group II, where NTG was used, it was more haemodynamically stable. This graph depicts mean arterial pressure during the rewarming; the mean arterial pressure was similar in both the groups. In group I patients, where Nitroglycerin was not used as a vasodilator during rewarming phase, spike like fluctuations were seen in mean arterial pressure. Whereas in group II, where NTG was used, it was more haemodynamically stable.
Table 4:Mean Heart Rate and Blood Pressure changes at different stages
This table shows group wise average heart rate and mean blood pressure at different stages of bypass. The average heart rate post bypass in group I was 106.56/min. and 106.39/min. in group II. The mean BP was 62.28 min. Hg in group I during rewarming while it was 67.42 mm Hg in group II during rewarming. The post bypass mean blood pressure was 65.01 mm Hg and 78.82 mm Hg in group II.
Table 5: Distribution of patients according to Post Induction, and Post Intubation temperature changes in Group I and II
Temperature changes at various sites immediately after endotracheal as well as upto 2 minutes after intubation were recorded. There was a definite rise in the skin temperature whereas rectal and nasopharyngeal temperatures either showed no change or decreased in most of the patients.The trend of various temperature i.e., Skin, Rectal and Nasopharyngeal temperatures during the pre bypass period in both groups I and II showed a downward trend post intubation.During bypass stage, the Skin, Rectal and Nasopharyngeal temperatures fell because of hypothermia. In both groups the rectal temperature fell slowly. The fall in skin temperature was maximum whereas nasopharyngeal temperature showed an intermediate fall.
Table 6: Cooling Process on Bypass
This table shows that the rate of cooling was faster in group II than group I patients. Out of the temperatures recorded at three sites, the fastest rate of cooling was at the nasopharyngeal site at a rate of 0.255⁰C/min in group I and 0.268⁰C/min in group II. The slowest to cool was the skin. It cooled at a rate f 0.236⁰C/min. in group I and 0.247⁰C/min in group II. The cooling process at the rectal site was intermediate in nature, the rate being 0.249⁰C/min in group I and 0.263⁰C/min in group II. The nasopharynx was fastest to cool and the skin was slowest to cool.The general trend of temperatures in Group I (without NTG) taken at different sites during rewarming phase of bypass, rise constantly but rectal temperature is slowest to rise. Sharp and quick rise is seen in the case of nasopharyngeal temperature which crosses rectal at 29.5⁰C after approximately 6 minutes. Further sharp rise in nasopharyngeal temperature is seen to peak at nearly 36.5⁰C. The skin temperature has small range of rise between 25.3⁰C-29.5⁰C. The trend of rise of nasopharyngeal temperature and skin is nearly identical depicting their pattern of similarity. The arterial blood temperature, starting from 26.6⁰C peaks at 31⁰C at the end of rewarming. Group II after NTG infusion during rewarming phase, the nasopharyngeal temperature showed a quicker and sharper rise than in the non NTG group. The nasopharyngeal temperature crossed the rectal temperature after 4 minutes. The rectal temperature showed small and gradual rise. The skin temperature showed rising trend in a linear fashion similar to nasopharyngeal temperature peaking at 32⁰C. The arterial blood temperature rose and became stable after 10 minutes. Table 7: Rewarming Process on Bypass
This table shows the temperature changes at different sites and the rate of rewarming during cardiopulmonary bypass. According to the table, the maximum gain in temperature (in degree centigrade) occurred at the nasopharyngeal site at the end of rewarming 7.2⁰C in group I and 8.18⁰C in group II. The least temperature gain occurred at the skin site. The rectal site gained 5.16⁰C in group I and 7.24⁰C in group II. The fastest rate of rewarming was at the nasopharynx. The total rewarming time was similar in both the groups. In group I after off bypass, the nasopharyngeal and skin temperatures showed a steady fall whereas, rectal temperature showed a rising trend. However, in group II (with NTG) after bypass, a fall in nasopharyngeal and skin temperature was seen similar to the non NTG group but it was of lesser degree. The rise in rectal temperature was also seen which crosses the nasopharyngeal temperature at 35 minutes off bypass. Table 8: Study of drop in Nasopharyngeal Temperature between the End of Bypass and at the Time of Shifting of the Patient
This table shows the after drop in the nasopharyngeal temperature between the end of rewarming phase of bypass and at the time of shifting of the patient to intensive care unit. The table clearly shows that in group I, the after drop of NPT is a mean of 1.53 while in group II NPT after drop is mean of 1.03⁰C. Thus, following bypass, the group II patients are seen to have less fall in NPT as compared to group I cases at the time of shifting to the intensive care unit.
Table 9: Mean Heart Rate and Blood Pressure changes at different stages of Surgery
This table shows the group wise mean temperatures at different stages of bypass. In group I, skin temperature on bypass was 28.43 ± 1.72⁰C which rose to 30.09 ± 3.31 at off bypass whereas, in NTG group, it rose from 27.95 ± 1.36⁰C to 31.93 ± 1.09⁰C.Similarly, rectal and nasopharyngeal temperatures in the NTG group after rewarming and at the time of off bypass were higher and more towards the pre-bypass level than non NTG group.
Table 10:
The ‘p’ values when compared at the end of rewarming to the start of rewarming was only significant in the nasopharyngeal temperature in group I while group II showed a highly significant rise in group I, at the time of off bypass, rectal as well as nasopharyngeal temperature showed a significant rise whereas in group II there was a highly significant rise in all the temperature sites.
Table 11:P Values For Drop in Naso Pharyngeal Temperature between the End of Bypass and Time of shifting the patient
There was highly significant after drop in nasopharyngeal temperature after bypass in group I. In the NTG group the fall was insignificant.
DISCUSSION The body temperature of an anaesthetised patient is measured for two main reasons – to monitor hypothermia or hyperthermia which may be induced selectively or may occur accidently e.g., in neonates and during prolonged anesthesia in adults and secondly to detect the onset of malignant hyperthermia. Controlled hypothermia as used in cardiac surgery is effected either by surface cooling or by extracorporeal cooling. It is important that body temperature should be brought down uniformly to the same level during cooling and restored in all regions equally during rewarming. Failure to do so may lead to gross fluctuations in temperature, disturbing metabolic functions and oxygen utilization. Temperature gradients do exist normally at different sites of the body and these are exaggerated after rapid cooling and rewarming. Large temperature variations can be hazardous in hypothermia, The temperature of heart determines the degree of protection afforded to it during coronary occlusion by aortic cross clamping. Monitoring the nasopharyngeal (NPT) and rectal temperature (RT) is a common practice in modern cardiac surgery with hypothermic cardiopulmonary bypass. Post operative hypothermia often triggers shivering, which can be treated by warming the skin surface. Cutaneous warming is effective because both core and skin temperature contributes to thermoregulatory responses. Maintaining intra operative normothermia is thus a preferable strategy for preventing post operative shivering and has the advantage of minimizing other hypothermia related complications. This was concluded by Chang et al (1994).Temperature is a physiologic variable that can be manipulated to suit the requirements of a particular management strategy according to patients' preoperative risk factors. Because of its profound physiologic and pathophysiologic implications, temperature is a crucial homeostatic variable, particularly in the setting of cardiac surgery during which significant changes in temperature can occur. (Saad and Aladawy, 2013). When vascular cooling and rewarming is employed, the entire body receives blood at the same temperature but different tissues differ in the rate at which their temperature changes depending upon their vascularity and thermal conductivity. Thus, peripheral vasoconstriction will influence the skin temperature during rewarming. Hence, the cutaneous temperature can provide an index for the perfusion status of the patient.With these factors in mind, it was considered feasible to study the behaviour of temperatures from various sites in the body, during the period of rapid changes produced by extracorporeal cooling and rewarming.
REFERENCES
|
|
||||||||||||||||||||||||||||||||||||||||||||||||||||||||||||||||||||||||||||||||||||||||||||||||||||||||||||||||||||||||||||||||||||||||||||||||||||||||||||||||||||||||||||||||||||||||||||||||||||||||||||||||||||||||||||||||||||||||||||||||||||||||||||||||||||||||||||||||||||||||||||||||||||||||||||||
 This work is licensed under a Creative Commons Attribution-NonCommercial 4.0 International License.