 Home
HomeOfficial Journals By StatPerson Publication
|
Table of Content - Volume 12 Issue 2 -November 2019
. A comparative study of haemodynamic response with laryngoscopic endotracheal intubation and laryngeal mask airway insertion in hypertensive patients at tertiary care hospital
Shrey Sharma1, Beula Govindan2*, Thavamani A3
1Senior Resident, 2,4Assistant Professor, 3Head of Department, Department of Anaesthesiology and Critical Care, Sreemookambika Institute Of Medical Sciences, Kulasekharam, Tamil Nadu, INDIA. Email: beulakiron@gmail.com
Abstract Background: The hemodynamic response associated with laryngoscopy and tracheal intubation may be harmful to certain patients. The laryngeal mask airway avoids the need for laryngoscopy and provides positive pressure ventilation of the lungs in appropriate patients. Aims and Objectives: This study compares the hemodynamic response of laryngoscopy and tracheal intubation to that of laryngeal mask airway insertion in hypertensive patients. Methods: 60 Hypertensive patients between 40 to 60 years of either gender of ASA Grade II were randomly allotted to one of the groups of 30 each, group ET and group LMA. LMA insertion or tracheal intubation was performed after induction of anesthesia with thiopentone and muscle relaxation with succinyl choline. Anesthesia was maintained with sevoflurane and nitrous oxide, oxygen. The heart rate, systolic BP, diastolic BP, mean arterial pressure and rate pressure product were measured after induction and immediately after LMA insertion / intubation and then after 1 ,3,5 minutes. Results: There was very highly significant difference (p< 0.000) in mean increase in heart rate (38.23% in group ET versus 28.26% in group LMA). The increase in arterial pressure were also significant. The systolic BP increased 40.16% in group ET compared with 37.60% in group LMA (p< 0.000). The diastolic BP was also seen increasing by 22.73% and 14.23% in group ET and group LMA respectively. The MAP and RPP values were maximum after airway instrumentation. However we found that values after LMA insertion were significantly lower when compared to tracheal intubation for the first 3 minutes. Interpretation and Conclusion: The data suggest a similar, but attenuated pattern of response associated with LMA insertion in comparison to laryngoscopy and intubation. Hence use of LMA may therefore offer some advantages over tracheal intubation in anesthetic management of patients where avoidance of pressor response is of particular concern. Key Word: laryngoscopic endotracheal intubation.
INTRODUCTION One of the most frequent and familiar methods of securing a definitive airway is laryngoscopy followed by endotracheal intubation during conduct of general anaesthesia.1 Direct laryngoscopy and intubation of the trachea during induction of anesthesia are routinely associated with transient tachycardia, arrhythmias and hypertension.2,3 Brief tachycardia and hypertension are of limited consequences in healthy individuals, but both or either may be deleterious to the patients with hypertension, myocardial insufficiency or cerebrovascular disease.4 The choice of anesthesia becomes more of a concern in such patients because most of them are old, frail and with one or more associated systemic comorbidities. Laryngoscopy and endotracheal intubation are noxious stimuli capable of producing a huge spectrum of stress responses such as tachycardia, hypertension, laryngospasm, bronchospasm, raised intracranial pressure and intraocular pressure.5 Reflex changes in the cardiovascular system are most marked after laryngoscopy and intubation and lead to an average increase in blood pressure by 40-50% and 20% increase in heart rate.6 Insertion of laryngeal mask airway (LMA) designed and advocated by Brain, has been broadly used in airway management for superficial and limb surgeries in selected populations. LMA placement, following anesthesia induction causes reduced haemodynamic changes than tracheal intubation. The laryngeal mask airway has proved to be a well-known addition to the range of equipment’s available for managing the airway. The transitional design of the LMA has shown to fill a hollow between ETT and oropharyngeal airway. The intermediate design of LMA avoided some draw backs of ETT while providing some of the advantages over ETT. This is primarily because the glottis is not visualised and not opened. In this comparative study, the hemodynamic stress response to insertion of laryngeal mask airway and laryngoscopic tracheal intubation in hypertensive patients were assessed.
AIMS AND OBJECTIVES
MATERIALS AND METHODS Our study is an observational study conducted in hypertensive patients undergoing elective surgery in Sree Mookambika Institute of Medical Sciences (SMIMS), Kulasekharam. The duration of the study was for a period of 12 months. The study population was divided into 2 groups: Group A: Group A or ETT Group consists of adult patients with hypertension undergoing elective surgeries not lasting more than 2-3 hours with endotracheal tube after laryngoscopy as a practice to secure airway during general anaesthesia in operation theatre complex of SMIMS, Kulasekharam. Group B: Group B or LMA Group consists of adult patients with hypertension undergoing elective surgeries not lasting more than 2-3 hours with Laryngeal mask airway insertion without laryngoscopy as a practice to secure airway during general anaesthesia in operation theatre complex of SMIMS, Kulasekharam. Sample size of each group: 30 Total sample size of the study: 60 Scientific basis of sample size used in the study: 𝒏=(𝒁𝜶+𝒁𝜷)²(𝑽𝟏+𝑽𝟐) (µ𝟏−µ𝟐−𝜹)² Where Zα=Z value associated with confidence = 1.64 Zβ = Z value associated with power = 0.84 V1 = variance of mean in Group A = 9.61[18] (According to Braude et al ) V2 = variance of mean in Group B = 15.96 µ1= mean of Group A = 122.7 µ2= mean of Group B = 126.9 δ = maximum clinical difference acceptable from µ 1 = 2.5 Hence, n = Sample size = 26.8 = 27 We are taking 30 sample size in each group. Inclusion Criteria:
Exclusion Criteria:
Blood pressure was recorded in the supine position on 3 occasions two hours apart and patients were taken up for the study with systolic BP < 180 mm Hg and diastolic < 110 mm Hg. Patients were advised to take oral anti hypertensives as per schedule with the last dose 6 hours prior to surgery. Each patient received pethidine 1 Mg/Kg and promethazine 0.5mg/Kg intramuscularly one hour prior to surgery as premedication. The patients were randomly allotted to one of the two groups (of 30 patients each) group ET and group LMA. The patients in group ET were intubated using Macintosh laryngoscope. The patients in group LMA received laryngeal maskairway insertion. A size 4 macintosh blade with an appropriate size endotracheal tube was used in patients of group ET and size 4 LMA was used in all patients in group LMA. Patients in both groups received preoxygenation via a face mask for 5 minutes. Anaesthesia was induced with thiopentone sodium 5 Mg/Kg I.V and after confirming loss of the eye lash reflex, succinylcholine 2Mg/Kg I.V was given for endotracheal intubation or LMA insertion. After the disappearance of fasciculations, tracheal intubation was performed in group ET and LMA was inserted blindly using the standard technique in group LMA. Anaesthesia was maintained with intermittent positive pressure ventilation using bain’s circuit with N2O 4L/Min and O2 2 L/Min and 2% Sevoflurane. The values of heart rate, systolic BP, diastolic BP, MAP were recorded after induction, immediately after intubation or insertion and at minute 1, 3 and 5. Rate pressure product which is a product of systolic BP and heart rate was derived at all the intervals. At the end of five minutes the anesthetic management deferred as per surgical requirements. Any kind of painful stimulus including surgical incision was not allowed while the readings were recorded. Patients on whom more than one attempt at either intubation or LMA insertion was tried were excluded from the study. Complications like leakage, coughing, gagging, laryngospasm, gastric distension after airway instrumentation did not occur during the study. All the values were expressed as mean + standard deviation. Statistical comparison were performed by students paired and unpaired t-test and chi-square test. P value of >0.05 was considered to be statistically not significant, a value of <0.05 as statistically significant, a P value of <0.01 as statistically highly significant and a P value of <0.001 as statistically very highly significant.
RESULTS The distribution of age in group ET ranges from 40 to 60 years. The mean age in the group ET was 47.93 years and a SD of 6.017 years. The distribution of age in group LMA ranges from 40 to 60 years. The mean age in the group LMA was 47.57 years and a SD of 6.947 years. In group ET, 60% were males while in group LMA, 70% were males (Table 1) Table 1
The distribution of weight in group ET ranges from 40 to 60 kg. The mean weight in the group ET was 47.93 kg and a SD of 6.017 kg. The distribution of weight in group LMA ranges from 40 to 60 kg. The mean weight in the group LMA was 47.57 kg and a SD of 6.947 kg. The heart rate increased post induction and remained elevated for more than 3 minutes in both the groups, after LMA insertion and tracheal intubation. The mean increase in heart rate for both the groups were almost similar. (Tables 2 and 3)
Table 2: Comparison of mean heart Rate
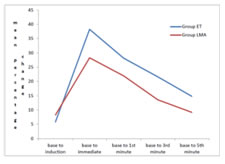
Table 3: Percentage change from The Baseline – Heart Rate
Figure 1: Percentage Change From The Baseline – Heart Rate
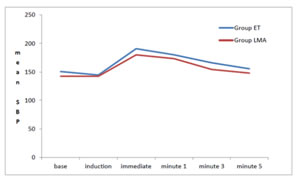
Very highly significant increase in the systolic BP after intubation was noted in Group ET when compared to insertion of LMA. Also the SBP remained elevated for 1st 3 minutes in both the groups. Hence there was a significant difference in the percentage increase in the SBP between both the groups. The percentage change of SBP from the base line was highly significant in Group ET. (Tables 4 and 5)
Table 4: Comparison Of Mean Systolic Bp
Table 5: Percentage Change From The Baseline –Systolic Bp
Figure 2: Comparison Of Mean Systolic Bp
The mean DBP remain elevated for 3 minutes in Group ET and for 1 minute in Group LMA after airway instrumentation. The values for mean increase in the DBP was significantly high in Group ET than Group LMA. The percentage change of DBP from baseline was significantly high in Group ET for 1,3,5 minutes whereas for Group LMA, it was comparatively low. (Tables 6 and 7)
Table 6: Comparison Of Mean Diastolic Bp
Table 7: Percentage Change From The Baseline–Diastolic Bp
The values of Rate Pressure product (RPP):
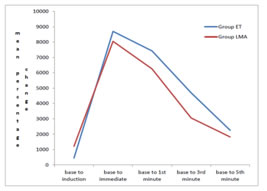
P value of <0.001 which is very highly significant was seen in both the groups. The meanincrease in the RPP was higher for Group ET. (Table 8)
Table 8: Percentage Change From The Baseline – Rate Pressure Product
Figure 3: Percentage Change From The Baseline – Rate Pressure Product
DISCUSSION The study included 60 patients with comparable demographic parameters like weight, gender and age. There was no statistically significant difference in the baseline parameters of HR, SBP, DBP, MAP, RPP between both groups. In our study post induction, the heart rate increased and again after endotracheal intubation or insertion of LMA. The values remained elevated for up to 5 minutes when compared with the baseline. From our study we found out that, in both the groups, the mean HR increased to a similar extent. But following LMA insertion, the percentage change from the baseline in HR was 28.26 % as compared to 38.23 % following endotracheal intubation. This difference is statistically significant with a p value <0.000***. This disparity can be explained by the fact that LMA stimulates both cardiac acceleratory and vagal fibres whereas the cardio acceleratory fibres is much more prominent on endotracheal intubation. The results were in parallel with Anita and collegues7 where while inserting LMA there was no significant increase (P > 0.05) in mean pulse rate but after intubation with endotracheal tube there was significant increase (P < 0.05) in pulse rate which remained high till 1 minute after intubation [ 9% in Group LMA and 11% in Group ETT]. Although the mean pulse rate returned to baseline value after 3 min which can be attributed to deeper depths of anesthesia achieved with the use of volatile anesthetics until 3 minutes of insertion and intubation. After induction the systolic and diastolic BP decreased in both our study groups, but airway instrumentation produced a very marked increase in both SBP and DBP following induction in both the groups. These came to40.16% in group ET and by 37.6% in group LMA. As seen from these values, Group LMA has lower increase in SBP and DBP than the ET group. This may be due to decreased total stimulation of afferent fibres in LMA group and ongoing stimulation due to the endotracheal tube present in situ. Similarly, a 22.73% and 14.23% increase in diastolic BP was observed in group ET and group LMA respectively, which was significantly higher in Group ET. Our results corresponded to the study conducted by Ali Abdulhamed Mohammed8colleagues where the rise in diastolic blood pressure was significantly high (p< 0.05) {86±4 in ETT Group and 78±7 in LMA Group immediately after insertion}. Our study was associated with decreased stress response for LMA insertion in comparison with ET tube insertion. This is probably because of the glosso epiglottic fold stimulation during laryngoscopy or insertion of LMA which is considered as a major cause for haemodynamic response. Shribman9 and colleagues concluded that the tension on the supraglottic tissues caused the sympatho-adrenal response. But in LMA Group, this lateral pressure on the pharyngeal mucosa by the LMA cuff was transient and when the mask was in situ, there was only a decreased pressure transmission as explained by Marjot et al.10 The RPP values also increased as a result of airway stimulation in both the groups. The RPP values in group ET reached a mean peak increase of 19532.67, corresponding mean peak increase in group LMA was 19081.80. In a study conducted by Jayita Sarkar11 and colleagues to differentiate between Hemodynamic response to endotracheal intubation using C-Trach assembly and direct laryngoscopy, they found that the rise in rate pressure product from basal value at all-time intervals was consistently higher in Group ETT as compared to Group LMA- C TRACH. Apart from the individual patient’s responses and discrepancies in the number of patients studied the other possible explanation for the differences among the study results could be because the patients were on different groups of antihypertensive drugs and were treated for variable duration. The observations of our study were not plotted beyond 5 minutes because of the possible return of neuromuscular conduction. Even though the intervals selected to record the haemodynamic response were closely related with the maximum changes that could occur after stimulation of airway, the absence of continuous monitoring in our study might have a role in altering the results. From this study we infer that in situations where intubation pressor response is desirably avoided, as in hypertensive patients, LMA should be preferred for selected surgeries.
CONCLUSION Our study concludes that, insertion of the laryngeal mask airway causes lesser haemodynamic response than tracheal intubation in hypertensive patients. Hence LMA should be the prefered method for airway management in this group of patients for superficial and limb surgeries in supine position with adequate fasting
REFERENCES
|
|
|||||||||||||||||||||||||||||||||||||||||||||||||||||||||||||||||||||||||||||||||||||||||||||||||||||||||||||||||||||||||||||||||||||||||||||||||||||||||||||||||||||||||||||||||||||||||||||||||||||||||||||||||||||||||||||||||||||||||||||||||||||||||||||||||||||
 This work is licensed under a Creative Commons Attribution-NonCommercial 4.0 International License.