 Home
Home
|
Table of Content - Volume 19 Issue 3 - September 2021
Role of pulse plethysmograph in the prediction of hypotension in caesarean section patient under spinal anesthesia
Sheetal K Desai1, Sandeep S Kadam2*, Aishwarya S Desai3, Sangeeta S Desai4
1Assistant Professor, 2Associate Professor, Department of Anesthesiology, 4Associate Professor, Department of Obstetrics and Gynecology, D.Y. Patil Medical College, D. Y. Patil Education Society (Deemed University), Kolhapur-416 006, Maharashtra, INDIA. 3Junior Resident, Department of Anesthesiology, Bharati Vidyapeeth Medical College, Bharati Vidyapeeth (Deemed-to-be-University), Pune- 411030, Maharashtra, INDIA. Email: klpskdesai@gmail.com, desai.aishwaryaarya@gmail.com, sangeetalawand@gmail.com, kadamsandeeps@gmail.com
Abstract Background: Spinal anesthesia is a commonly employed technique for anesthesia for caesarean section and is associated with hypotension which may cause maternal morbidity. Prediction of hypotension before the procedure can reduce complications. The study aimed to evaluate the role of pulse plethysmograph in the prediction of hypotension in caesarean section patients under spinal anesthesia. Methods: The observational study was conducted on 50 patients who were undergoing emergency or elective caesarean section. Spinal anesthesia was performed by anaesthesiologist using a 25 or 26-gauge spinal needle with bupivacaine at L3-4 interspinous space. Pre and post-anesthesia observations such as the width of pulse plethysmograph, non-invasive blood pressure in another arm, and heart rate were recorded. Paired T-test, Wilcoxon sign rank test, and chi-square test was used to analyse data using R Studio V 1.2.5001 software. Results: Post spinal anesthesia minor fall in systolic blood pressure (SBP) was observed in 11 patients, moderate fall in 21 patients, severe fall in 8 patients and a massive fall in 10 patients. A significant difference was observed between mean pre- and post-spinal anesthesia SBP (P<0.001). Width of pulse plethysmograph (PPG) was maintained in 14 patients whereas, narrowed and significantly narrowed PPGs were observed in 29 and 7 patients, respectively. Significant association was observed between grades of SBP and width of PPG (P<0.05). Receiver operating characteristic curve showed the width of PGG was good for prediction of hypotension in patient (AUC=0.828). Conclusion: Width of PPG can be used to predict SA induced maternal hypotension. Keywords: Bupivacaine, Blood pressure, Caesarean section, Hypotension, Perfusion index, Spinal anesthesia.
INTRODUCTION Spinal anesthesia (SA) is a commonly used technique for anesthesia in caesarean delivery, associated with maternal hypotension which may cause distressing maternal symptoms, rapid deterioration of neonatal conditions, maternal and neonatal morbidity.1 A simple prediction of hypotension can allow preventing the fall of blood pressure and its associated risks.2 Various methods for prediction of maternal hypotension have been explored this including baseline heart rate, heart rate variability, body mass index, advanced age, and preoperative anxiety but none have been widely accepted. Perfusion index is reported for effective assessment of perfusion dynamics and vascular tone derived from plethysmography waveforms, obtained from pulse oximeter probe.3,4 Plethysmography waveform of a pulse oximeter is sensitive to change in vascular tone, gives insight into nature of cardiovascular changes.[5] A normal waveform is characterized by a sharp systolic upstroke and peak and a prominent dicrotic notch on the downward portion of the curve. Any changes in the morphology (width, change in position of diacritic notch) are considered as abnormal.6 The width of PPG is a width measured at half height of the systolic peak. The systemic vascular resistance (SVR) is associated with width of PPG as the SVR changes the width of wave also changes.5 The study was aimed to evaluate the role of morphology of pulse plethysmograph in the prediction of hypotension in caesarean section patient under spinal anesthesia. The objective of the study was to evaluate the role of pulse plethysmograph in the prediction of hypotension in caesarean section patient under spinal anesthesia.
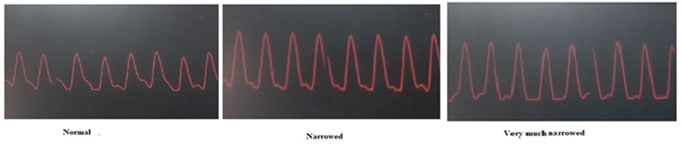
MATERIALS AND METHODS (PATIENTS AND METHODS) The observational study was performed for one year (2017-18) after approval of the institutional ethical committee, on 50 patients, posted for emergency or elective caesarean section. Purposive sampling technique was used. Informed consent was obtained from the patients before the surgery. Patients over 40 years of age, diabetes mellitus, hypertension before pregnancy, heart diseases, obesity, height less than 140cm or more than 170cm and hemoglobin less than 8gm% were excluded from the study. In operation theatre electrocardiogram, pulse oximetry, and non-invasive blood pressure monitor (Philip makes Sure Sign VM18) was attached and baseline vitals were recorded. The width of PPG was captured in camera and it is measured based on visual impression of single investigator throughout the study. The drop of dicrotic notch of PPG towards baseline showed narrowing of PPG width, whereas drop and merging of diacrotic notch with baseline showed very much narrowed width of PPG (figure 1).
Figure 1: Width of PPG
Premedication such as ranitidine 50mg, metoclopramide 10mg, ondansetron 4mg; and oxygen at the rate of 4lit/min by nasal cannula was given. Intravenous access was secured, and all patients were preloaded with Ringer lactate solution (500ml). At the L3-L4 intervertebral space spinal block was administered using 0.5% bupivacaine (2.2c.c) by 25-gauge spinal needle with patients in the left lateral position under all aseptic precautions. After 3 minutes spinal anesthesia all parameters such as systolic blood pressure, heart rate, and width of PPG was recorded and graded. Grading for fall in systolic blood pressure (SBP) and change in heart rate were based on the following grades; Fall in systolic blood pressure: Minor (Fall by less than 10% of preoperative baseline SBP), moderate: Fall between >10% but less than 20% of preoperative baseline SBP, Severe: Fall between >20% but less than 30% of preoperative baseline SBP, Massive: Fall by > 30% of baseline SBP; Change in heart rate: Drop-in rate <-20% of baseline (A), Drop-in rate up to -20% of baseline (B), No drop or increase in Heart rate (C), Rise in heart rate up to 25% of baseline (D), Rise in heart rate above 25 % but up to 50% of baseline (E), Rise above 50% of baseline (F). The sample size was calculated by using the formula:
Calculated sample size was 44 and the power of study was 90%. Statistics Data were analysed using R studio v 1.2.5001 software. Paired t-test and Wilcoxon-sign-rank tests were performed to find the mean difference. ANOVA was used to find a difference in systolic blood pressure according to width of base PPG. Chi-square test was performed to find the association between variables and systolic blood pressure, P<0.05 considered as statistically significant.
RESULTS The average age of the patients was 26.46±4.24 years, ranging from 20-35 years. Patients who had delivery for the first time (Primipara) was observed in 29 cases. There was no pregnancy induced hypotension in 45 cases. (table 1) Table 1: Demographic characteristics of the Patients
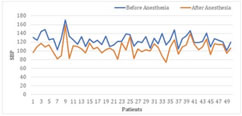
Post spinal anesthesia minor fall in SBP was observed in 16 patients, moderate fall in 20 patients, severe fall in 9 patient and a massive fall in 5 patients (figure 2).
Figure 2: Distribution of patients according to SBP before and after spinal anesthesia The minimum fall of SBP was 2.5% and the maximum was 37.60% (figure 2). A significant difference was observed between mean pre- and post-spinal anesthesia SBP (P<0.001). The width of PPG was maintained in 14 patients whereas, narrowed and very much narrowed PPGs were observed in 29 and 7 patients, respectively. A significant association was observed between grades of SBP and the width of PPG (P<0.0030) (table 2). Whereas no significant association was found between HR and PPG. Table 2: Association between SBP and the width of PPG
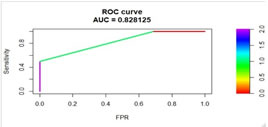
SBP: systolic blood pressure; PPG: pulse plethysmograph; P: statistically significant value, Chi-square test was used to find the association, *Significant. Data was balanced using synthetic over sampling technique for obtaining area under curve (AUC) value of receiver operating characteristic curve (ROC). The AUC value (0.828) showed that the width of PPG was a good for prediction of hypotension (figure 3). Figure 3: Receiver operating characteristic curve
DISCUSSION Spinal anesthesia is the well-known method of administering anesthesia in caesarean section and hypotension is the complication associated with it.7 Hypotension is the result of circulatory collapse due to sudden drop in compensatory measures such as systemic vascular resistance, which requires continues monitoring using the invasive technique.5 Early prediction of hypotension after spinal anesthesia can reduce maternal complications. The study was aimed to evaluate the role of pulse plethysmograph in the prediction of hypotension in caesarean section patient under spinal anesthesia. The incidence of minor, moderate, severe, and massive spinal anesthesia-induced hypotension was 32%, 40%, 18%, and 10% respectively. These results were supported by the studies of Brenck F. et al. and Fakherpour et al.8-9 As the systemic vascular resistance increases the width of PPG is increases.[5] Similarly, after SA the width of PPG was narrowed in most of the cases due to hypotension. A significant association was found between grades of SBP and the width of PPG (P<0.01127). No similar studies were found to support these results. However, the study of Awad AA et al. showed a fair correlation of systemic vascular resistance with a width of plethysmographic waveforms.[5] Hanss et al. suggest that patients with heart rate variability after SA are more likely to develop hypotension.[10] Various other studies showed an association between HR and hypotension.9-11 In the current study, no association was found between PPG and HR. No studies are available to support the association between PPG and HR. PPG indicates the movement of blood in small arteriolar vessels from the heart to the fingertips. PPG is affected by heartbeats, hemodynamic and change in tone of the arteriole.12-13 Two changes were commonly observed such as a change in the width of PPG with a drop in SBP and change in HR with change SBP. A significant association was observed between grades of SBP and width of PPG but not between HR and PPG. However, receiver operating characteristic curve showed the width of PGG was good for prediction of hypotension in patient (AUC=0.828). Blood pressure is product of cardiac output and SVR and can be judged from change in morphology of PPG. Therefore, morphological changes in PPG can be used to predict hypotension. Limitations of the study are, the observations were recorded at 3 min interval after SA, as some patients may show hypotension at a different time interval. A study with multiple and narrow time interval observations of the width of PPG and dicrotic notch by a single observer is the further recommendations of the study.
CONCLUSION The narrowing of width of PPG and merging of diacrotic notch with the baseline of PPG is associated with the fall of SBP; which can be used to predict SPINAL ANAESTHESIA induced maternal hypotension.
REFERENCES
Policy for Articles with Open Access
|
|
|||||||||||||||||||||||||||||||||||||||||||
 This work is licensed under a Creative Commons Attribution-NonCommercial 4.0 International License.