 Home
Home
|
Table of Content - Volume 1 Issue 1 - January 2017
Peripheral venous pressure as a reliable predictor for monitoring central venous
Vikas S Joshi1*,Lulu Sherif2
1Junior Resident, 2Associate Professor, Department of Anaesthesiology and Critical Care Medicine, Father Muller Medical College, Manglore, Karnataka, INDIA. Email: vikass_joshi@yahoo.com
Abstract Objectives: To determine a reliable association between changes in CVP and PVP in varied hemodynamic status in burns. To determine long term correlation during the first 10 hours. Method: The CVP and peripheral venous pressure (PVP) were measured simultaneously in 30 patients within 10 consecutive hours. Results: The mean difference between CVP and PVP was 1.628±0.84 mmHg. (p<0.001). The linear regression equation showed that CVP was 0.374+0.774 PVP (r2 = 0.725). Conclusion: PVP measured from a peripheral intravenous catheter in burns patients is an accurate estimation of CVP and its changes has good concordance with CVP over a long period of time. Keywords: Peripheral venous pressure; Central venous pressure, Monitoring; burns
INTRODUCTION Burns patients frequently require monitoring of central venous pressure(cvp). There are some risks associated with catheterisation , including arterial puncture,pneumothorax,surgical sites, altered anatomy due to burns and contractures pose a significant risk for CVP catheter placement in certain patients1,3. In view of the above restrictions, studies were carried out to show the correlation between CVP and peripheral venous pressure (PVP)measurements1,3,4. In emergency conditions, the estimation of CVP is possible via measurement of PVP.
AIM OF THE STUDY To determine a reliable association between changes in CVP and PVP in varied hemodynamic status in burns. Long term correlation during the first 10 hours.
MATERIALS AND METHODS SOURCE OF DATA 30 burns patients admitted to burns ICU at Father Muller Medical College Mangalore. CVP access- 7 Fr triple-lumen, Arrow International catheter with placement via the left or right internal jugular or subclavian vein. The peripheral measurement of CVP was obtained from a peripheral intravenous (IV) site using a standard IV catheter. CVP was measured from both the central venous catheter and the peripheral IV catheters, simultaneously.
MONITORS Philips and Spacelabs monitoring device The following parameters were recorded hourly, for a period of 10 hours. Age Weight Height Site of CVP Site of PVP and IV catheter size.
ANALYSIS OF DATA The differences between the central and peripheral CVP were evaluated using paired t test. The predictability of CVP by PVP was examined using linear regression analysis at a p value of ≤ 0.05.
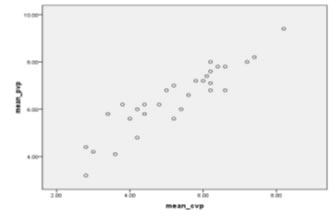
RESULTS Demographic data: Age : 18 to 65 years Weight : 40 to 65 kgs Gender distribution: 20 males and 10 females The predictability of CVP by PVP was tested by applying the linear regression The overall mean difference between CVP and PVP was 1.628±0.84 mmHg (p<0.001).
Figure 1: Linear regression plot of PVP versus CVP during 10 hours with 95% confidence interval
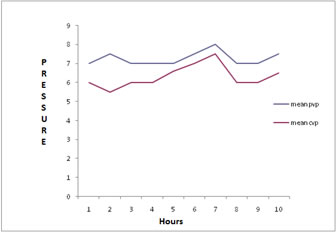
The mean difference between CVP and PVP in each hour is shown below. Figure 2: The top tracing shows the mean PVP and the bottom tracing is the simultaneous mean CVP. The distance between the two tracings shows the difference of pressure over a long period of time remains almost constant.
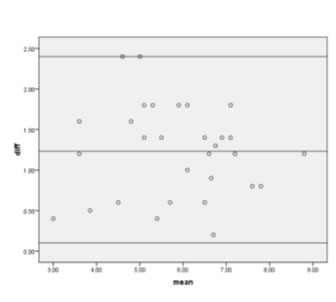
For estimation of agreement between CVP and PVP during the 10 hours period, Bland-Altman diagram was used.
Figure 3: Bland-Altman diagrams for the comparison between CVP and PVP measurements during 10 hours in 30 patients. The dotted horizontal line indicates perfect agreement (difference of -1.2),the dotted lines indicate a clinically relevant difference of plus or minus 1.96. standard deviation (SD)
DISCUSSION Previous studies have shown a consistent correlation between CVP and PVP measurements. However, studies in burns groups are limited and shows controversial results. The results in our study were comparable with Amar et al. who demonstrated the same intra operatively during both mechanical ventilation and spontaneous ventilation.1 Tugrul et al.,4 used different catheter sizes (for PVP measurement) and different patient positions during simultaneous measurement of PVP and CVP measurement at random time points. They concluded that a constant relationship exists between PVP and CVP with 2-mmHg difference. Hoftman et al.,5 confirm that PVP correlates with CVP even under adverse hemodynamic conditions in patients undergoing liver transplantation. Munis et al.6 Reported their experience with PVP in 15 patients undergoing neurosurgical procedures. They observed a significant relationship between PVP and CVP with a Pearson coefficient of 0.82.
CONCLUSION CVP can be estimated from PVP measurement. The differences between CVP and PVP remain relatively constant over a period of time. Therefore, evaluation of hemodynamic changes occurring with dehydration or volume overload can be made by measuring PVP.
REFERENCES
Policy for Articles with Open Access
|
|
 .
. This work is licensed under a Creative Commons Attribution-NonCommercial 4.0 International License.