Comparison of the effect of different timing of premedication with fentanyl on the hemodynamic stress response to laryngoscopy
Uma R1, Radhika K2*, Pravin Kumaar R3, Vinoth E4, John Peter D5
1,2 Associate Professor, 3,4,5Post Graduate, Department of Anaesthesiology, ESIC MC and PGIMSR, K. K. Nagar, Chennai, Tamil Nadu, INDIA.
Email: radhikamurali0095@gmail.com
Abstract Background: One of the main challenges an anaesthesiologist faces in the conduct of general anaesthesia is obtundation of the hemodynamic stress response to laryngoscopy and intubation. Various pharmacological interventions have been used to this end and the most popular agent among them is the use of short acting opiods such as fentanyl. In this study we show how the timing of this premedicant is as important as its dosage. Methods: In our study 90 patients undergoing elective surgeries under general anaesthesia were divided into three groups to be premedicated with fentanyl at 3,5,7 minutes respectively and anaesthesia was induced and the heart rate systolic, diastolic and mean arterial blood pressure were recorded at baseline, induction, intubation and at 1,3,5,10 minutes after intubation and compared. Results: in our study we found that the response obtundation was maximum in the 7 minutes group as compared to the 3 and 5minutes group. Thus we conclude that timing of a drug is as important as its dosing.
Key Words: medication.
INTRODUCTION
Laryngoscopy and tracheal intubation is always associated with a hemodynamic stress response as described by Reid and Brace1 in 1940. From then on studies are on for various pharmacological measures to reduce this response. Various drugs such as opiods2,3, local anaesthetics4,5, sympatholytics6,7,8, vasodilators9 and inhaled anaesthetics10. This raise in blood pressure and heart rate induced by laryngoscopy though transient can be deleterious in compromised patients11. In today’s fast moving world we are moving away from intramuscular premedication towards intravenous premedication which has greater and more reliable bioavailability and with the advent of more potent and rapid acting opioids, this has become the main mode of premedication these days. It also has the added advantage of avoiding painful intramuscular injections. Fentanyl a phenylpiperidine synthetic congener of morphine has rapid onset of action (3-4minutes) and is 100 times more potent than morphine12. It is cardiac stable. It is an excellent short acting analgesic at lower initial doses of 2mcg per kg, due to its large volume of distribution and rapid redistribution due to high lipid solubility. However continuous infusion may cause cumulative effects due to the saturation of extra vascular sites and slow hepatic metabolism. It undergoes extensive first pass metabolism. Unlike its congener morphine it does not have histamine releasing property. Due to these attributes it is routinely used as a premedicant these days. However the haste to start surgeries hinders with ideal timing of the premedicant and attenuates its beneficial effects. Hence this study was conducted to identify the right timing of fentanyl premedication which produces maximum suppression of stress response of laryngoscopy.
MATERIALS AND METHODS
After obtaining institutional ethical committee approval and obtaining written informed consent from 90 patients of ASA physical status I and II, undergoing elective surgeries under general anaesthesia of the age group 20-60 years, weight 40-90 kgs, of either sex and a modified mallampati grading of 1 or 2 were included in the study. Patients who were unwilling, undergoing emergency surgeries or hypertensive patients and patients with IHD or patients on beta blockers and antihypertensives where excluded from the study. Patients were divided into three groups by slips in box technique:
GROUP A: Premedication with fentanyl(2mcg per/kg) 3 minute prior to intubation
GROUP B: Premedication with fentanyl(2mics/kg) 5 minutes prior to intubation
GROUP C: Premedication with fentanyl(2mics/kg) 7 minutes prior to intubation
Standard monitors were connected and Pulse oximetry (SpO2), heart rate(HR), Noninvasive blood pressure monitoring(NIBP), Electrocardiogram(ECG) were attached and baseline pulse rate, blood pressure(systolic blood pressure (SBP), diastolic blood pressure (DBP) and mean arterial pressure(MAP)) and oxygen saturation were recorded.
An intravenous line was started before procedure with 18G cannula. Oxygen at the rate of 4 l/min was administered through face mask. Patients were premedicated with inj.midazolam 0.03mg/kg 5minutes prior to induction. Then patients were induced with inj. Propofol (2mg/kg) and paralysed with inj.vecuronium(0.15mg/kg) and intubated with appropriate size ET tube after 3minutes of bag and mask ventilation with nitrous oxide and oxygen in the ratio of 2:1 and 1MAC sevoflurane. Depending on the group, patients were given inj. Fentanyl 2mcg/kg at the respective timing and saline at the other two timing in order to blind the person conducting anaesthesia (that is in the patient in 3minute group the injection given at 7minutes and 5 minutes prior to intubation will contain saline and the injection 3 minute prior will contain fentanyl). The period of laryngoscopy was limited to 10secs(those cases exceeding the time period or requiring more than one attempt of laryngoscopy were excluded from the study). The heart rate, systolic blood pressure, diastolic blood pressure and mean arterial pressure were noted at the following time intervals pre operative, at induction, after induction, at intubation and at 1,3,5 and 10 minutes after intubation Subsequently anaesthesia was maintained as per the anaesthetist’s preference. The parametric variables were described using descriptive statistics such as mean, standard deviation (SD), standard error etc. The non parametric variables were represented as percentages or ratios. To find the difference among three groups, One Way ANOVA Model was used. To find a better group, multiple comparison was done by LSD-post hoc test among three groups. The difference was considered statistically significant at p value <0.05. The analysis were performed using SPSS statistical software (version 21.0). The graph were provided by Microsoft office Excel.
RESULTS
In this study, the difference in the mean age and mean weight were not significant among the three groups at p=0.586 and p=0.403 respectively indicating that there was not much selection bias.
Table 1:
Descriptive Statistics |
One Way ANOVA |
Study Parameters |
Premedication with fentanyl (2mcg per/kg) Groups prior to intubation |
N |
Min. value |
Max. value |
Mean |
Std. Dev. |
Std. Error |
95% CI for mean |
Lower |
Upper |
F test |
p value |
Age (years) |
3 minutes |
30 |
17 |
63 |
42.4 |
14.5 |
2.6 |
37.0 |
47.8 |
0.537 |
0.586 |
5 minutes |
30 |
18 |
63 |
40.2 |
15.2 |
2.8 |
34.6 |
45.9 |
7 minutes |
30 |
18 |
63 |
38.5 |
14.1 |
2.6 |
33.3 |
43.8 |
Weight (kg) |
3 minutes |
30 |
36 |
89 |
58.0 |
13.2 |
2.4 |
53.1 |
62.9 |
0.918 |
0.403 |
5 minutes |
30 |
45 |
80 |
60.5 |
9.0 |
1.6 |
57.1 |
63.8 |
7 minutes |
30 |
45 |
82 |
61.6 |
8.6 |
1.6 |
58.4 |
64.8 |
Table 2: Sex distribution
GROUP |
MALE |
FEMALE |
RATIO |
3 minutes |
15 |
15 |
15:15 |
5 minutes |
17 |
13 |
17:13 |
7 minutes |
16 |
14 |
16:14 |
The sex distribution was also comparable among the three groups.
Table 3: Descriptive Statistics and One Way ANOVA for Pulse rate at various intervals.
Descriptive Statistics |
Statistical Test:
One Way ANOVA |
Study Parameters |
Premedication with fentanyl (2mcg per/kg) Groups prior to intubation |
N |
Min. value |
Max. value |
Mean |
SD |
SEM |
95% CI for mean |
Lower |
Upper |
F test |
p value |
Baseline pulse rate |
3 minutes |
30 |
61 |
104 |
85.1 |
11.5 |
2.1 |
80.8 |
89.4 |
1.885 |
0.158 |
5 minutes |
30 |
56 |
97 |
80.0 |
10.0 |
1.8 |
76.2 |
83.7 |
7 minutes |
30 |
52 |
101 |
80.3 |
12.8 |
2.3 |
75.5 |
85.1 |
Pulse rate at time of the induction |
3 minutes |
30 |
62 |
121 |
91.8 |
13.2 |
2.4 |
86.8 |
96.7 |
15.964 |
0.0001*** |
5 minutes |
30 |
62 |
108 |
80.0 |
10.1 |
1.8 |
76.2 |
83.7 |
7 minutes |
30 |
53 |
91 |
76.4 |
9.5 |
1.7 |
72.8 |
79.9 |
Pulse rate at time of the intubation |
3 minutes |
30 |
65 |
126 |
98.3 |
15.3 |
2.8 |
92.6 |
104.0 |
35.871 |
0.0001*** |
5 minutes |
30 |
65 |
106 |
83.3 |
9.5 |
1.7 |
79.7 |
86.8 |
7 minutes |
30 |
56 |
90 |
74.2 |
6.9 |
1.3 |
71.6 |
76.8 |
Pulse rate at 1 minutes |
3 minutes |
30 |
67 |
126 |
100.3 |
14.5 |
2.6 |
94.9 |
105.7 |
53.142 |
0.0001*** |
5 minutes |
30 |
67 |
111 |
85.9 |
9.9 |
1.8 |
82.2 |
89.6 |
7 minutes |
30 |
53 |
85 |
71.0 |
7.4 |
1.4 |
68.2 |
73.8 |
Pulse rate at 3 minutes |
3 minutes |
30 |
65 |
126 |
96.4 |
13.0 |
2.4 |
91.5 |
101.2 |
63.145 |
0.0001*** |
5 minutes |
30 |
57 |
102 |
77.5 |
10.1 |
1.8 |
73.7 |
81.3 |
7 minutes |
30 |
51 |
84 |
66.3 |
7.7 |
1.4 |
63.4 |
69.2 |
Pulse rate at 5 minutes |
3 minutes |
30 |
61 |
120 |
88.6 |
12.2 |
2.2 |
84.0 |
93.2 |
46.235 |
0.0001*** |
5 minutes |
30 |
55 |
91 |
74.1 |
8.9 |
1.6 |
70.8 |
77.4 |
7 minutes |
30 |
51 |
85 |
64.7 |
7.4 |
1.3 |
61.9 |
67.4 |
Pulse rate at 10 minutes |
3 minutes |
30 |
60 |
117 |
79.8 |
11.2 |
2.1 |
75.6 |
84.0 |
22.315 |
0.0001*** |
5 minutes |
30 |
56 |
104 |
72.5 |
9.4 |
1.7 |
69.0 |
76.0 |
7 minutes |
30 |
51 |
89 |
63.7 |
6.9 |
1.3 |
61.1 |
66.3 |
*** Highly significant
The p value (p>0.158) showed that there was no significant difference in baseline values of pulse rate among three groups but there was highly significant difference at all other timings.
Table 4: Multiple comparison by LSD-post hoc test among three groups
Study parameters |
(I) group |
(J) group |
Mean Difference
(I-J) |
p value |
95% C I LB UB |
Baseline pulse rate |
3 minutes |
5 minutes |
5.133 |
0.087 |
-0.77 |
11.03 |
3 minutes |
7 minutes |
4.833 |
0.107 |
-1.07 |
10.73 |
5 minutes |
7 minutes |
-0.3 |
0.92 |
-6.2 |
5.6 |
Pulserate at time of the induction |
3 minutes |
5 minutes |
11.800* |
0.0001 |
6.13 |
17.47 |
3 minutes |
7 minutes |
15.400* |
0.0001 |
9.73 |
21.07 |
5 minutes |
7 minutes |
3.6 |
0.21 |
-2.07 |
9.27 |
Pulserate at time of the intubation |
3 minutes |
5 minutes |
15.033* |
0.0001 |
9.32 |
20.75 |
3 minutes |
7 minutes |
24.100* |
0.0001 |
18.39 |
29.81 |
5 minutes |
7 minutes |
9.067* |
0.002 |
3.35 |
14.78 |
Pulse rate at 1 minutes |
3 minutes |
5 minutes |
14.367* |
0.0001 |
8.72 |
20.02 |
3 minutes |
7 minutes |
29.300* |
0.0001 |
23.65 |
34.95 |
5 minutes |
7 minutes |
14.933* |
0.0001 |
9.28 |
20.58 |
Pulse rate at 3 minutes |
3 minutes |
5 minutes |
18.900* |
0.0001 |
13.52 |
24.28 |
3 minutes |
7 minutes |
30.100* |
0.0001 |
24.72 |
35.48 |
5 minutes |
7 minutes |
11.200* |
0.0001 |
5.82 |
16.58 |
Pulse rate at 5 minutes |
3 minutes |
5 minutes |
14.500* |
0.0001 |
9.52 |
19.48 |
3 minutes |
7 minutes |
23.933* |
0.0001 |
18.95 |
28.92 |
5 minutes |
7 minutes |
9.433* |
0.0001 |
4.45 |
14.42 |
Pulse rate at 10 minutes |
3 minutes |
5 minutes |
7.300* |
0.003 |
2.5 |
12.1 |
3 minutes |
7 minutes |
16.100* |
0.0001 |
11.3 |
20.9 |
5 minutes |
7 minutes |
8.800* |
0.0001 |
4 |
13.6 |
At the time of induction, the mean difference in pulse rate between the groups 3 minutes vs 5 minutes and 3 minutes vs 7 minutes were highly significant whereas the group 5 minutes vs 7 minutes didn’t show any significant difference in their mean. At the time of intubation and followed by various time intervals such as 1, 3, 5, 10 minutes showed highly significant difference in the mean pulse rate among each of the groups and even between the 5minute and 7minute group indicating 7minutes group to be better than the other two.
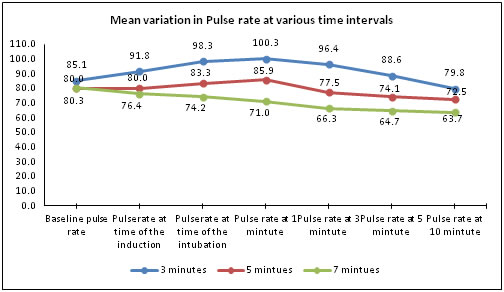
Figure 1:
Table 5: Descriptive Statistics and One Way ANOVA for Systolic Blood Pressure at various intervals
Descriptive Statistics |
Statistical Test |
Study Parameters |
Premedication with fentanyl (2mcg per/kg) Groups prior to intubation |
N |
Min. value |
Max. value |
Mean |
Std. Dev. |
Std. Error |
95% CI for mean |
One Way ANOVA |
Lower |
Upper |
F test |
p value |
Baseline SBP |
3 minutes |
30 |
95 |
140 |
119.0 |
12.6 |
2.3 |
114.3 |
123.7 |
0.156 |
0.856 |
5 minutes |
30 |
96 |
135 |
117.4 |
11.0 |
2.0 |
113.3 |
121.5 |
7 minutes |
30 |
98 |
134 |
117.9 |
9.9 |
1.8 |
114.2 |
121.6 |
SBP at time of the induction |
3 minutes |
30 |
90 |
138 |
111.2 |
12.8 |
2.3 |
106.4 |
116.0 |
1.316 |
0.274 |
5 minutes |
30 |
87 |
139 |
111.8 |
12.1 |
2.2 |
107.2 |
116.3 |
7 minutes |
30 |
85 |
135 |
107.2 |
10.8 |
2.0 |
103.1 |
111.2 |
SBP at time of the intubation |
3 minutes |
30 |
99 |
144 |
122.4 |
12.2 |
2.2 |
117.9 |
127.0 |
12.576 |
0.0001*** |
5 minutes |
30 |
95 |
158 |
118.1 |
13.0 |
2.4 |
113.3 |
123.0 |
7 minutes |
30 |
90 |
123 |
107.6 |
9.7 |
1.8 |
104.0 |
111.3 |
SBP at 1 minute |
3 minutes |
30 |
91 |
141 |
122.9 |
11.9 |
2.2 |
118.5 |
127.4 |
12.478 |
0.0001*** |
5 minutes |
30 |
97 |
164 |
120.8 |
13.2 |
2.4 |
115.8 |
125.7 |
7 minutes |
30 |
92 |
124 |
109.2 |
8.7 |
1.6 |
105.9 |
112.4 |
SBP at 3 minutes |
3 minutes |
30 |
94 |
132 |
117.4 |
10.3 |
1.9 |
113.6 |
121.2 |
11.167 |
0.0001*** |
5 minutes |
30 |
89 |
132 |
115.1 |
11.1 |
2.0 |
111.0 |
119.2 |
7 minutes |
30 |
90 |
120 |
105.9 |
8.4 |
1.5 |
102.8 |
109.0 |
SBP at 5 minutes |
3 minutes |
30 |
88 |
122 |
112.7 |
9.2 |
1.7 |
109.3 |
116.2 |
7.944 |
0.001** |
5 minutes |
30 |
88 |
127 |
109.7 |
9.2 |
1.7 |
106.3 |
113.2 |
7 minutes |
30 |
88 |
115 |
103.8 |
8.0 |
1.5 |
100.8 |
106.8 |
SBP at 10 minutes |
3 minutes |
30 |
93 |
122 |
111.1 |
8.7 |
1.6 |
107.9 |
114.4 |
8.764 |
0.0001*** |
5 minutes |
30 |
90 |
126 |
108.5 |
8.4 |
1.5 |
105.4 |
111.7 |
7 minutes |
30 |
81 |
114 |
102.4 |
7.9 |
1.4 |
99.4 |
105.3 |
*** Highly significant, ** very significant
The p values (p>0.856, p > 0.274) showed that there is no significant difference in baseline values of SBP and at the time of induction respectively. At the time of intubation and at various time intervals of 1,3,5,10 minutes showed highly significant difference in mean SBP among the three groups
Table 5: Multiple comparison by LSD-post hoc test among three groups
Study parameters |
(I) group |
(J) group |
Mean Difference (I-J) |
p value |
95% C I LB UB |
Baseline SBP |
3 minutes |
5 minutes |
1.567 |
0.59 |
-4.19 |
7.33 |
3 minutes |
7 minutes |
1.133 |
0.697 |
-4.63 |
6.89 |
5 minutes |
7 minutes |
-0.433 |
0.881 |
-6.19 |
5.33 |
SBP at time of the induction |
3 minutes |
5 minutes |
-0.6 |
0.846 |
-6.73 |
5.53 |
3 minutes |
7 minutes |
4 |
0.198 |
-2.13 |
10.13 |
5 minutes |
7 minutes |
4.6 |
0.139 |
-1.53 |
10.73 |
SBP at time of the intubation |
3 minutes |
5 minutes |
4.3 |
0.16 |
-1.73 |
10.33 |
3 minutes |
7 minutes |
14.800* |
0.0001 |
8.77 |
20.83 |
5 minutes |
7 minutes |
10.500* |
0.001 |
4.47 |
16.53 |
SBP at 1 minutes |
3 minutes |
5 minutes |
2.133 |
0.473 |
-3.75 |
8.01 |
3 minutes |
7 minutes |
13.733* |
0.0001 |
7.85 |
19.61 |
5 minutes |
7 minutes |
11.600* |
0.0001 |
5.72 |
17.48 |
SBP at 3 minutes |
3 minutes |
5 minutes |
2.3 |
0.374 |
-2.82 |
7.42 |
3 minutes |
7 minutes |
11.500* |
0.0001 |
6.38 |
16.62 |
5 minutes |
7 minutes |
9.200* |
0.001 |
4.08 |
14.32 |
SBP at 5 minutes |
3 minutes |
5 minutes |
2.967 |
0.195 |
-1.55 |
7.49 |
3 minutes |
7 minutes |
8.900* |
0.0001 |
4.38 |
13.42 |
5 minutes |
7 minutes |
5.933* |
0.011 |
1.41 |
10.45 |
SBP at 10 minutes |
3 minutes |
5 minutes |
2.151 |
0.23 |
-1.68 |
6.88 |
3 minutes |
7 minutes |
2.151 |
0.0001 |
4.49 |
13.04 |
5 minutes |
7 minutes |
2.151 |
0.005 |
1.89 |
10.44 |
*Significant
At the time of intubation and followed by various time intervals such as 1,3,5,10 minutes; the groups, 3 minutes vs 7 minutes and the group 5 minutes vs 7 minutes showed very significant difference in their mean SBP whereas no difference in the group 3 minutes vs 5 minutes at the above all time intervals. SBP at baseline, during induction, all three groups showed no significant difference in mean SBP.
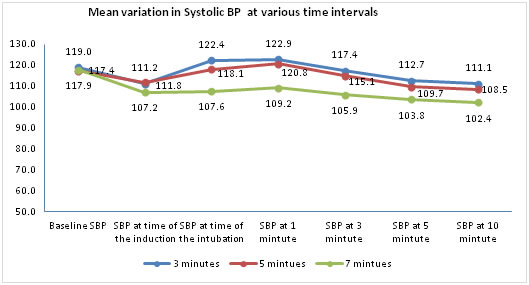
Figure 2:
Table 6: Descriptive Statistics and One Way ANOVA for Diastolic Blood Pressure at various intervals
Descriptives |
One Way ANOVA |
Study Parameters |
Premedication with fentanyl (2mcg per/kg) groups prior to intubation |
N |
Min. value |
Max. value |
Mean |
Std. Dev. |
Std. Error |
95% CI for mean |
Lower |
Upper |
F test |
p value |
Baseline DBP |
3 minutes |
30 |
56 |
90 |
76.3 |
9.0 |
1.6 |
72.9 |
79.7 |
0.965 |
0.385 |
5 minutes |
30 |
64 |
98 |
78.9 |
8.5 |
1.5 |
75.7 |
82.0 |
7 minutes |
30 |
67 |
93 |
78.6 |
5.7 |
1.0 |
76.5 |
80.7 |
DBP at time of the induction |
3 minutes |
30 |
50 |
92 |
74.3 |
11.5 |
2.1 |
70.0 |
78.6 |
0.357 |
0.701 |
5 minutes |
30 |
58 |
97 |
74.2 |
9.3 |
1.7 |
70.8 |
77.7 |
7 minutes |
30 |
62 |
83 |
72.5 |
5.4 |
1.0 |
70.5 |
74.5 |
DBP at time of the intubation |
3 minutes |
30 |
56 |
103 |
81.3 |
9.8 |
1.8 |
77.7 |
85.0 |
8.163 |
0.001** |
5 minutes |
30 |
57 |
121 |
77.9 |
11.8 |
2.2 |
73.4 |
82.3 |
7 minutes |
30 |
60 |
79 |
71.6 |
5.6 |
1.0 |
69.5 |
73.7 |
DBP at 1 minutes |
3 minutes |
30 |
57 |
92 |
81.0 |
10.0 |
1.8 |
77.3 |
84.8 |
7.646 |
0.001** |
5 minutes |
30 |
61 |
107 |
79.3 |
10.1 |
1.8 |
75.5 |
83.0 |
7 minutes |
30 |
61 |
83 |
72.6 |
5.5 |
1.0 |
70.5 |
74.7 |
DBP at 3 minutes |
3 minutes |
30 |
49 |
87 |
73.1 |
9.3 |
1.7 |
69.6 |
76.5 |
2.079 |
0.131 |
5 minutes |
30 |
51 |
92 |
75.2 |
9.0 |
1.6 |
71.8 |
78.5 |
7 minutes |
30 |
56 |
82 |
70.9 |
5.8 |
1.1 |
68.7 |
73.0 |
DBP at 5 minutes |
3 minutes |
30 |
48 |
82 |
71.3 |
8.7 |
1.6 |
68.1 |
74.6 |
0.967 |
0.384 |
5 minutes |
30 |
51 |
88 |
72.4 |
7.8 |
1.4 |
69.5 |
75.3 |
7 minutes |
30 |
58 |
82 |
69.8 |
5.5 |
1.0 |
67.7 |
71.8 |
DBP at 10 minutes |
3 minutes |
30 |
56 |
83 |
72.0 |
8.0 |
1.5 |
69.0 |
75.0 |
2.076 |
0.132 |
5 minutes |
30 |
61 |
88 |
71.9 |
6.3 |
1.1 |
69.5 |
74.2 |
7 minutes |
30 |
52 |
80 |
68.7 |
6.8 |
1.2 |
66.2 |
71.2 |
** very significant
The mean DBP was significantly different between the three groups only during intubation and at 1minute following intubation. There was no significant difference at the other timings.
Table 7: Multiple comparison by LSD-post hoc test among three groups
Study parameters |
(I) group |
(J) group |
Mean Difference (I-J) |
p value |
95% C I
LB UB |
Baseline DBP |
3 minutes |
5 minutes |
-2.567 |
0.21 |
-6.6 |
1.47 |
3 minutes |
7 minutes |
-2.3 |
0.261 |
-6.34 |
1.74 |
5 minutes |
7 minutes |
0.267 |
0.896 |
-3.77 |
4.3 |
DBP at time of the induction |
3 minutes |
5 minutes |
0.033 |
0.989 |
-4.63 |
4.7 |
3 minutes |
7 minutes |
1.733 |
0.462 |
-2.93 |
6.4 |
5 minutes |
7 minutes |
1.7 |
0.471 |
-2.96 |
6.36 |
DBP at time of the intubation |
3 minutes |
5 minutes |
3.467 |
0.159 |
-1.39 |
8.32 |
3 minutes |
7 minutes |
9.733* |
0 |
4.88 |
14.59 |
5 minutes |
7 minutes |
6.267* |
0.012 |
1.41 |
11.12 |
DBP at 1 minute |
3 minutes |
5 minutes |
1.767 |
0.439 |
-2.75 |
6.29 |
3 minutes |
7 minutes |
8.433* |
0 |
3.91 |
12.95 |
5 minutes |
7 minutes |
6.667* |
0.004 |
2.15 |
11.19 |
DBP at 3 minutes |
3 minutes |
5 minutes |
-2.1 |
0.322 |
-6.29 |
2.09 |
3 minutes |
7 minutes |
2.2 |
0.3 |
-1.99 |
6.39 |
5 minutes |
7 minutes |
4.300* |
0.045 |
0.11 |
8.49 |
DBP at 5 minutes |
3 minutes |
5 minutes |
-1.1 |
0.57 |
-4.93 |
2.73 |
3 minutes |
7 minutes |
1.567 |
0.419 |
-2.26 |
5.4 |
5 minutes |
7 minutes |
2.667 |
0.17 |
-1.16 |
6.5 |
DBP at 10 minutes |
3 minutes |
5 minutes |
1.823 |
0.956 |
-3.52 |
3.72 |
3 minutes |
7 minutes |
1.823 |
0.077 |
-0.36 |
6.89 |
5 minutes |
7 minutes |
1.823 |
0.086 |
-0.46 |
6.79 |
*significant
At the time of intubation and 1minute following intubation mean DBP of the groups, 3 minutes vs 7 minutes and the group 5 minutes vs 7 minutes showed very significant difference whereas no difference in the group 3 minutes vs 5 minutes. DBP at 3 minutes following intubation, only the group 5 min. versus 7 min. group showed significant difference in mean DBP.
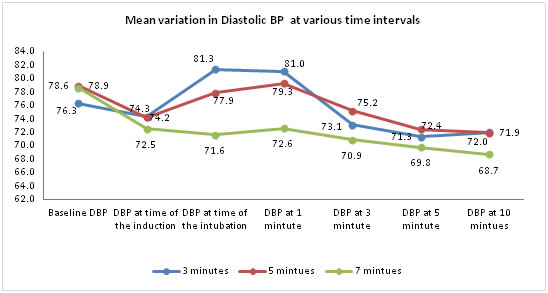
Figure 3:
Table 8: Descriptive Statistics and One Way ANOVA for MAP at various intervals
Descriptives |
One Way ANOVA |
Study Parameters |
Premedication with fentanyl (2mcg per/kg) groups prior to intubation |
N |
Min. value |
Max. value |
Mean |
SD |
SEM |
95% CI for mean |
Lower |
Upper |
F test |
p value |
Baseline MAP |
3 minutes |
30 |
70 |
105 |
90.5 |
1.8 |
86.9 |
94.2 |
0.183 |
0.833 |
5 minutes |
30 |
77 |
108 |
91.7 |
1.7 |
88.3 |
95.1 |
7 minutes |
30 |
78 |
106 |
91.7 |
1.2 |
89.2 |
94.2 |
MAP at time of the induction |
3 minutes |
30 |
64 |
106 |
86.6 |
2.1 |
82.3 |
90.9 |
0.728 |
0.486 |
5 minutes |
30 |
72 |
106 |
86.7 |
1.8 |
83.1 |
90.4 |
7 minutes |
30 |
71 |
98 |
84.1 |
1.3 |
81.5 |
86.6 |
MAP at time of the intubation |
3 minutes |
30 |
70 |
117 |
95 |
1.9 |
91.2 |
98.8 |
10.804 |
0.0001*** |
5 minutes |
30 |
74 |
133 |
91.3 |
2.1 |
86.9 |
95.7 |
7 minutes |
30 |
71 |
94 |
83.6 |
1.2 |
81.2 |
86 |
MAP at 1 minutes |
3 minutes |
30 |
68 |
108 |
95 |
1.9 |
91.1 |
98.9 |
10.01 |
0.0001*** |
5 minutes |
30 |
76 |
126 |
93.1 |
2 |
89 |
97.2 |
7 minutes |
30 |
73 |
95 |
84.8 |
1.1 |
82.4 |
87.1 |
MAP at 3 minutes |
3 minutes |
30 |
65 |
102 |
87.8 |
1.7 |
84.5 |
91.2 |
4.448 |
0.014* |
5 minutes |
30 |
64 |
105 |
88.5 |
1.8 |
84.9 |
92.1 |
7 minutes |
30 |
69 |
93 |
82.5 |
1.2 |
80.2 |
84.9 |
MAP at 5 minutes |
3 minutes |
30 |
65 |
95 |
85.1 |
1.6 |
81.9 |
88.4 |
2.592 |
0.081 |
5 minutes |
30 |
63 |
101 |
84.9 |
1.5 |
81.9 |
87.9 |
7 minutes |
30 |
71 |
92 |
81.1 |
1.1 |
78.9 |
83.3 |
MAP at 10 minutes |
3 minutes |
30 |
68 |
94 |
85 |
1.4 |
82.1 |
87.9 |
4.44 |
0.015* |
5 minutes |
30 |
71 |
101 |
84.1 |
1.2 |
81.6 |
86.6 |
7 minutes |
30 |
64 |
89 |
79.9 |
1.2 |
77.5 |
82.4 |
** very significant
The p values (p>0.833, p > 0.486) showed that no significant difference in baseline values of MAP and at the time of induction respectively. At the time of intubation and MAP at 1 minute showed highly significant difference in mean DBP. The difference was significant at 3minutes and 10minutes following intubation also.
Table 9: Multiple comparison by LSD-post hoc test among three groups
Study parameters |
(I) group |
(J) group |
Mean Difference
(I-J) |
p value |
95% C I
LB UB |
Baseline MAP |
3 minutes |
5 minutes |
-1.189 |
0.597 |
-5.64 |
3.27 |
3 minutes |
7 minutes |
-1.156 |
0.607 |
-5.61 |
3.3 |
5 minutes |
7 minutes |
0.033 |
0.988 |
-4.42 |
4.49 |
MAP at time of the induction |
3 minutes |
5 minutes |
-0.178 |
0.943 |
-5.09 |
4.73 |
3 minutes |
7 minutes |
2.489 |
0.317 |
-2.42 |
7.4 |
5 minutes |
7 minutes |
2.667 |
0.284 |
-2.25 |
7.58 |
MAP at time of the intubation |
3 minutes |
5 minutes |
3.744 |
0.139 |
-1.24 |
8.72 |
3 minutes |
7 minutes |
11.422* |
0.0001 |
6.44 |
16.4 |
5 minutes |
7 minutes |
7.678* |
0.003 |
2.7 |
12.66 |
MAP at 1 minutes |
3 minutes |
5 minutes |
1.889 |
0.438 |
-2.93 |
6.71 |
3 minutes |
7 minutes |
10.200* |
0.0001 |
5.38 |
15.02 |
5 minutes |
7 minutes |
8.311* |
0.001 |
3.49 |
13.13 |
MAP at 3 minutes |
3 minutes |
5 minutes |
-0.633 |
0.773 |
-4.98 |
3.71 |
3 minutes |
7 minutes |
5.300* |
0.017 |
0.96 |
9.64 |
5 minutes |
7 minutes |
5.933* |
0.008 |
1.59 |
10.28 |
MAP at 5 minutes |
3 minutes |
5 minutes |
0.256 |
0.897 |
-3.67 |
4.18 |
3 minutes |
7 minutes |
4.011* |
0.045 |
0.09 |
7.93 |
5 minutes |
7 minutes |
3.756 |
0.06 |
-0.17 |
7.68 |
MAP at 10 minutes |
3 minutes |
5 minutes |
1.823 |
0.61 |
-2.69 |
4.56 |
3 minutes |
7 minutes |
1.823 |
0.006 |
1.48 |
8.72 |
5 minutes |
7 minutes |
1.823 |
0.025 |
0.54 |
7.79 |
*significant
The mean difference in comparison of baseline MAP among three groups was equal (p>0.05). And also MAP at the time of induction (p>0.05) MAP at the time of intubation and followed by at 1 minute, 3 minutes and 5 minutes; the groups, 3 minutes vs 7 minutes and the group 5 minutes vs 7 minutes showed very significant difference in their mean MAP whereas no difference in the group 3 minutes vs 5 minutes. MAP at 5 minutes, only the group 3 min. versus 7 min. showed significant difference in mean MAP. MAP at10 minutes, all three groups showed no significant difference in mean MAP.
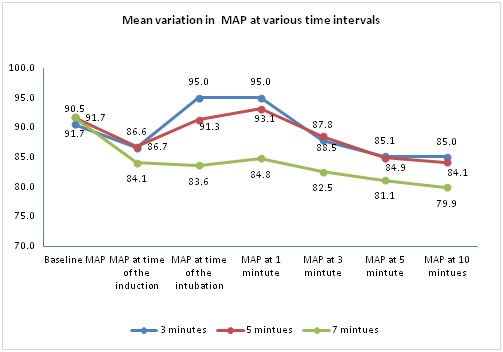
Figure 4:
DISCUSSION
Direct laryngoscopy and tracheal intubation are noxious stimuli associated with transient raise in heart rate and blood pressure. It even causes dysrhythmias and myocardial ischaemia in susceptible individuals [11,13,14]. This response varies depending on various factors such as depth of anaesthesia, difficulty in the airway, the expertise of the anaesthetist, duration of laryngoscopy and patient factors such as diabetes [15], heart disease [16,17], raised intracranial tension and cerebral vascular malformations11 Various drugs and their combinations have been used to obtund this response. Various opioids are among the preferred choice for this as they have the added advantage of providing analgesia also intraoperatively. That too with the advent of newer faster and more potent opioids this has become the mainstay of premedication. Of these opioids fentanyl is the most widely used opioid and numerous studies have been published regarding the correct dosage of fentanyl to be used for this purpose and a few on the correct timing of the drug too 18,19,20,21,22. Our study mainly tries to find the right timing of fentanyl premedication in order to resensitize the readers to the fact that timing of the drug is as important as the dosage and type of the drug. In our study all hemodynamic parameters such as heart rate, SBP, DBP and MAP were significantly lower in the 7minutes group as compared to the 3 and 5 minutes groups. The mean heart rate was significantly lower in both the 5 minutes and 7 minutes groups at all time intervals right from induction to 10 minutes post intubation and also there was significant difference among the 5 and 7 minutes groups also. Thereby prooving that fentanyl given 7 minutes prior to intubation is more effective in obtunding the heart rate response to direct laryngoscopy and endotracheal intubation. In a study conducted by Seong Hoon19 they compared the effects of different timing of fentanyl at 1,3,5,10 minutes pre intubation for the effect on heart rate and MAP at induction and 1 minute post intubation and concluded that the suppression of the intubation response was maximum in the 5 minutes group and the 10 minute group offering no further added advantage over the 5 minutes group.
Similarly the MAP was also significantly lower in the 5 and 7 minutes groups when compared to the 3 minutes group especially during intubation and 1 minute after that. This is also comparable to the study by Seong Hoon19 in which again there was significant difference in the 5 minute group when compared to the 1 and 3minutes group. In a study by Martin21 it was proved that low dose fentanyl at a dose of 2 mics /kg was sufficient to obtund the intubatory response and it was also associated with lesser side effects such as muscle rigidity, respiratory depression when compared to using higher doses.
CONCLUSION
Thus we conclude that the optimal dosing of fentanyl is as important as its optimal dosage or its combinations. In our study we found that the correct timing of fentanyl was 7minutes when compared to the 3 and 5 minutes groups. Obtunding the stress response to laryngoscopy and intubation is a very essential part of general anaesthesia. Though the rise in heart rate and blood pressure is only transient and may not be deleterious in normal healthy subjects in patients with cardiovascular instability it may be harmful and has to be kept in mind during every general anaesthetic delivered.
REFERENCES
-
Reid LC, Brace DE. Irritation of the respiratory tract and its reflex effect upon heart. Surg Gynaec and Obstretics.1940;70:157-62
-
Dahlgren N, Messeter K. Treatment of stress response to laryngoscopy and intubation with fentanyl. Anaesthesia 1981;36:1022-6.
-
Kautto U-M. Attenuation of the circulatory response to laryngoscopy and intubation by fentanyl. Acta Anaesthesiol Scand 1982;26:217-21
-
Stoelting RK. Blood pressure and heart rate changes during short duration laryngoscopy for tracheal intubation- influence of viscous or intravenous lignocaine. Anaesth Analg 1978;57:197-9
-
Gurulingappa, MD Asif Aleem, MN Awati, Adarsh S. Attenuation of cardiovascular responses to direct laryngoscopy and intubation – A comparative study between iv bolus fentanyl, lignocaine and placebo(NS). Jr of Diag and Clin Research 2012 Dec;6(10):1749-52
-
Magnusson J, Thulin T et al. Haemodynamic effects of pretreatment with metaprolol in hypertensive patients undergoing surgery. Br J Anaesth 1986;58:251-60
-
Ghignone M, Quintin L et al. Effects of clonidine on narcotic requirements and haemodynamic responses during induction of fentanyl anaesthesia and endotracheal intubation. Anaesthesiology 1986;64:36-42
-
Erum Ozair, Qazi Ehsan Ali et al. A comparative evaluation of dexmedetomidine and fentanyl to attenuate hemodynamic stress response to laryngoscopy and intubation. Asian J of Medical Sciences 2018 Jan-Feb; 9(1):65-72
-
Stoelting RK. Attenuation of blood pressure response to laryngoscopy and tracheal intubation with sodium nitroprusside. Anesth Analg1979; 58:116-9
-
Milacco I, Axson – Lof B et al. Haemodynamic stability during anaesthesia induction and sternotomy in patients with ishcaemic heart disease: a comparison of six anaesthetic techniques. Acta Anaesthesiol Scand 1985; 29:465-73
-
Pernerstofer T, Krafft P et al. Stress response to tracheal intubation: direct laryngoscopy compared with blind oral intubation. Anaesthesia 1995 Jan; 50(1):17-22
-
Collins VJ. Principles of anaesthesiology general and regional anaesthesia. 3rd edition; vol I and II Philladelphia: Lea and Febiger 1993
-
Chraemmer – Jorgenson B, Hertel S et al. Catecholamine response to laryngoscopy and intubation. The influence of three different drug combinations commonly used for induction of anaesthesia. 1992 Sep; 47(9):750-6
-
Kovac L. Controlling the hemodynamic response to laryngoscopy and endotracheal intubation. J. Clin. Anesth. Anesth. 1996 Feb;8(1):63–79.
-
Vohra A, Kumar S, Charlton AJ,.Effect of diabetes mellitus on the cardiovascular responses to induction of anaesthesia and tracheal intubation. Br. J. Anaesth 1993 Aug [71(2):258–61.
-
Low JM, Harvey JT, Prys-Roberts C, Studies of anaesthesia in relation to hypertension. VII: Adrenergic responses to laryngoscopy. Br. J. Anaesth. [Internet]. 1986 May;58(5):471–7.
-
FIGUEREDO E and GARCIA-FUENTES E. M. Assessment of the efficacy of esmolol on the haemodynamic changes induced by laryngoscopy and tracheal intubation : A meta-analysis. Acta Anaesthesiol Scand. 2001;1(11):1011–22.
-
Channaiah VB, Chary K, Vlk JL, Low-dose fentanyl : hemodynamic response to endotracheal intubation in normotensive patients. Arch Med Sci. 2008;3(september):293–9.
-
Song H. Small-Dose Fentanyl: Optimal Time of Injection for Blunting the Circulatory Responses to Tracheal Intubation. Anesth. Analg. 1998;86:658–61.
-
Feng CK, Chan KH, Liu KN, Or CH, Lee TY. A comparison of lidocaine, fentanyl, and esmolol for attenuation of cardiovascular response to laryngoscopy and tracheal intubation. Acta Anaesthesiol..1996 Jun 34(2):61–7.
-
Martin DE, Rosenberg H, Aukburg SJ,Low-dose fentanyl blunts circulatory responses to tracheal intubation. Anesth. Analg 1982 Aug61(8):680–4.
-
Chung F, Evans D. Low-dose fentanyl : haemodynamic response during induction and intubation in geriatric patients. Can. J. Anaesth. 1985;32(6):622–8
 Home
Home This work is licensed under a Creative Commons Attribution-NonCommercial 4.0 International License.