 Home
Home
|
Table of Content Volume 17 Issue 2 - February 2021
Spectrum of HRCT lung and chest radiograph findings in patients with coronavirus disease (COVID-19) at a tertiary care hospital in Mumbai, India
Shivraj Ingole1, Charudutt Desai2*, Nidhi Singh3
1Associate Professor, 2,3Resident, Department of Radiology, J J hospital, Byculla, Mumbai, Maharashtra, INDIA. Email: drshivraj@gmail.com, charudutt100@gmail.com, ndhsingh78@gmail.com
Abstract Background: To report the spectrum of chest radiography and computed tomographic (CT) imaging findings in corona virus disease-19 (COVID-19) infected patients in Mumbai, India. Methods: This was a retrospective cross sectional study comprising 200 reverse transcriptase polymerase chain reaction (RT-PCR) positive and symptomatic patients who underwent chest radiography and CT chest. Prevalence, distribution, extent and type of abnormal lung findings were recorded. Results: Among 200 patients, 128 (64%) were males and 72 (36%) were females with mean age of 47.8 ±16.1 years (range 09–82 years). Fever was the commonest symptom seen in 59% cases followed by fatigue or malaise 47.6 %. 38% of the patients complained of breathlessness. Co morbidities were present in 25% cases. Forty two percent patients showed abnormalities on radiograph. Ground glass opacities were the most common finding (45/84, 53.5%), followed by consolidation (24/84, 28.5%). Peripheral (48/84, 57.1%) and lower zone distribution (77/84, 92%) were the more common locations and most had bilateral involvement (61/84, 72.6%). Fifty two patients with negative chest radiograph demonstrated ground glass opacities on CT. On CT, lung parenchymal abnormalities were observed in 136 (68%) cases, whereas 64 (32%) RT-PCR positive cases had a normal chest CT. Among the patients with abnormal CT, the most common finding was bilateral peripheral ground glass opacities (GGO). Pure GGO was observed in 42(31%), GGO with crazy paving pattern was seen in 38(28%) and GGO mixed with consolidation was noted in 57 (42 %). Peri-lesional or intralesional segmental or subsegmental vessel enlargement was seen in 97 (71 %) cases. 32 cases (23%) showed sub pleural lines. Conclusion: In this study population, one-third of RT-PCR positive patients had normal chest radiograph and HRCT lung whereas the remaining patients showed typical findings of predominant GGOs with a bilateral distribution and peripheral predominance. Keywords: Covid-19, Covid pneumonia, , chest radiograph, HRCT.
INTRODUCTION Coronavirus disease 2019 (COVID-19) is caused by severe acute respiratory syndrome Coronavirus 2 (SARS-CoV-2)1 which is an enveloped single-stranded RNA virus.2,3 The first case of COVID-19 in India, which originated from China, was reported on 30 January 2020. The clinical manifestations of Coronavirus disease can be divided on the basis of severity as, Mild disease: Non pneumonia and mild pneumonia. Severe disease: Dyspnea, respiratory frequency ≥ 30/min, blood oxygen saturation (SpO2) ≤ 93%, PaO2/FiO2 ratio or P/F [the ratio between the blood pressure of the oxygen (partial pressure of oxygen, PaO2) and the percentage of oxygen supplied (fraction of inspired oxygen, FiO2)] < 300, and/or lung infiltrates > 50% within 24 to 48 hours. Critical disease: respiratory failure, septic shock, and/or multiple organ dysfunction (MOD) or failure (MOF).4 The keys to control COVID-19 are early discovery, early isolation, and early treatment. The diagnostic test for coronavirus disease 2019 (COVID-19) infection is a reverse transcription polymerase chain reaction (RT-PCR) test. However, there has been a severe shortage of test kits worldwide; furthermore, laboratories in most countries have struggled to process the available tests within a reasonable time frame. Although efforts to increase the capacity for RT-PCR testing have been underway, health care workers attempting to triage symptomatic patients have turned to imaging in the form of chest radiography or CT. Imaging is part of triage to assess pulmonary health and direct patients to the appropriate parts of the health care system. There are several strategies and flowcharts used to diagnose and rule out COVID-19, and chest radiography and CT have been widely used as part of the initial screening process. Undoubtedly, the real-time reverse transcription polymerase chain reaction (RT-PCR) assay remains the standard of reference, but it was reported that false-negative RT-PCR was not rare and in these patients, initial chest CT might present abnormal findings indicating COVID-19.5 However, with an alarming increase in the number of infected population in India, Chest radiography emerges as a fast and relatively inexpensive imaging modality. The diagnostic value of HRCT lung mainly lies in the detection of lesions, even early lesions that which are missed on radiography and before the clinical symptoms become apparent, characterization of lesion and assessment of severity to facilitate further clinical management.6 Chest CT scan shows 97% and 75% sensitivity for the diagnosis of specimen positive and negative patients respectively but with only 25% specificity. 7 Imaging findings of COVID-19 closely resemble other viral pneumonias and mainly include ground glass opacities (GGO) with a peripheral and basal predominance as the initial manifestation of the disease. There is a gradual transformation of GGOs into consolidations during the intermediate stage of the disease. The CT findings peak around 9–13 days after symptom onset. Clinical recovery is associated with a gradual resorption of pulmonary opacities with development of subpleural lines, reticulations, fibrous stripes and perilobular opacities, usually apparent after the second week. In some patients the clinical course is complicated by acute respiratory distress syndrome (ARDS) or pulmonary embolism, the main causes of death8. Pleural effusion, pericardial effusion, mediastinal lymphadenopathy are seen in patients with severe disease. 9,10 With advent of scoring system like CT severity score, it is possible to identify patients with severe forms of COVID-19.11 The aim of the present study was to report the chest radiograph and CT imaging manifestations of SARS-CoV-2 infection in Mumbai, India.
MATERIALS AND METHODSStudy design and Study populationThis study is a retrospective cross-sectional study. This will be a retrospective statistical study carried out in Department of Radio diagnosis of tertiary care hospital. 200 patients with proven COVID-19 infection were enrolled in this study; aged 15–80 years. The COVID-19 infection was confirmed using the RT-PCR test. All patients were symptomatic, presented with variable degrees of fever, cough, and dyspnea. Inclusion criteriaPatients with symptoms such as fever, cough, fatigue, sore throat and/or dyspnea with RT-PCR confirmed SARS-COV-2 infection.Exclusion criteriaDouble negative RT-PCR swab. Asymptomatic patients with positive RT-PCR.Chest Radiograph protocolChest radiographs were acquired on Canon DR 1000 with posteroanterior (PA) view as standard frontal chest projection with KVp of 65 and mAs of 12-13. It was performed with patient erect and in full inspiration and the patient hugging the detector to pull the scapulae laterally. Lying down radiographs were taken for debilitated patients. Portable system was used to acquire chest radiograph for ICU patients. Chest Radiograph analysis Radiographic features including consolidation, ground glass opacities (GGO), and pulmonary nodules were diagnosed according to the Fleischner Society glossary of terms. Distribution of the lung changes was categorized into (i) peripheral predominance, perihilar predominance (peripheral and perihilar demarcation was defined as halfway between lateral edge of the lung and hilum), or neither; (ii) right, left, or bilateral lung involvement; and (iii) upper zone, lower zone (defined as upper/ lower halves) or no zonal predominance. Presence of pleural effusion was also recorded. CT SCANNING PROTOCOL A high-resolution CT (HRCT) scan was performed in all patients with 128-slice multi-detector row CT scanners (Siemens SOMATOM AS). Patients were scanned in the supine position; head first, during breath-hold. Scanning parameters were tube voltage 100−120 kV, tube current 110−280 mA, pitch 1.375, FOV 350−400 mm. The 1.0 mm thick images were reconstructed using a high-frequency reconstruction algorithm- classic filtered back-projection method with a soft tissue kernel of B20 and a lung kernel of B60. Coronal and sagittal multiplanar reconstructions were also available in all cases. All examinations were non-enhanced and no intravenous contrast medium was administered. Chest radiograph analysisA detailed evaluation of the images was done and pulmonary changes identified included ground-glass opacity (GGO), consolidation, reticular opacities, pulmonary nodules, cavitation and pleural effusion. On chest radiographs, ground-glass opacity was defined as an area of hazy increased lung opacity, usually extensive, within which margins of pulmonary vessels may be indistinct. Ground-glass opacity is less opaque than consolidation, in which bronchovascular margins are obscured.12 Consolidation was defined as a homogeneous increase in pulmonary parenchymal attenuation that obscures the margins of vessels and airway walls .An air bronchogram may be present. Reticular pattern is a collection of innumerable small linear opacities that, by summation, produce an appearance resembling a net. Pulmonary nodule is a rounded opacity, well or poorly defined, measuring up to 3 cm in diameter. The distribution of pulmonary changes was furthermore identified as unilateral vs. bilateral and central vs. peripheral distribution. Zonal distribution was reported as upper, middle and lower zone. Lung changes were identified as peripheral if limited to the outer one-third and central when confined to the inner two-thirds of the lung. Diffuse changes when both peripheral and central zones were affected simultaneously. The characteristic of the abnormal finding was further classified as patchy or nodular. HRCT image analysisA detailed evaluation of the images was done and pulmonary changes identified included ground-glass opacity (GGO), consolidation, crazy paving, tree-in-bud, broncho-vascular thickening, bronchiectasis, pulmonary nodules, cavitation, and pleural effusion. GGO (ground glass opacity) was defined as an increase in the density of lung with non-obscuration of bronchial and vascular structures, whereas consolidation was defined as increased density of lung tissue through which vascular and bronchial structures were not visible.12 The distribution of pulmonary changes was furthermore identified as unilateral vs. bilateral and central vs. peripheral distribution. Lobar distribution was reported as upper, middle/lingular, lower, and multi-lobar distribution (two or more lobes). Lung changes were identified as peripheral if limited to the outer one-third and central when confined to the inner two-thirds of the lung. Diffuse changes when both peripheral and central zones were affected simultaneously. The distribution of lung abnormalities were also divided into anterior and posterior location (lung tissue anterior to a line drawn midway on axial CT was defined as anterior and the portion behind it was defined as posterior). In all cases, a semi-quantitative CT severity scoring proposed by Pan et al.13,14 was calculated per each of the 5 lobes considering the extent of anatomic involvement, as follows: 0, no involvement; 1, < 5% involvement; 2, 5–25% involvement; 3, 26–50% involvement; 4, 51–75% involvement; and 5, > 75% involvement.
OBSERVATION AND RESULTS Among the total study cohort of 200 patients, 128 (64 %) were males and 72 (36%) were females with mean age of 47.8 ±16.1 years (range 09–82years). Fever was the commonest symptom seen in 118 (59%) followed by fatigue or malaise in 95 (47.6%), cough in 72 (36%) and sore throat in 40 (20 %). 76 (38%) of the patients were dyspneic. Co morbidities were present in 50 (25%) patients. Patient demographics and clinical features are summarized in table below.
Table 1: Demographics
84 out of 200 cases (42%) demonstrated abnormalities on radiograph. Ground glass opacities was the most common finding (45/84, 53.5%), followed by consolidation (24/84, 28.5%). Mixed pattern was seen in 15/84 patients (17.8%). Reticulations was seen in 9/84 patients (10.7%) Pleural effusion was found in 9/84 cases (10.7%).Peripheral (48/84, 57.1%) and lower zone distribution (77/84, 92%) were the more common locations, and most had bilateral involvement (61/84, 72.6%). 52 patients who had negative radiographs demonstrated ground glass opacities on HRCT.
Table 2: Chest Radiograph Findings
HRCT findings Lung parenchymal abnormalities were observed in 136 (68%) cases, whereas 64 (32%) RT-PCR positive cases had a normal chest CT. Among the patients with abnormal CT findings, bilateral lung involvement was the commonest, observed in 120 cases (88%). Multiple lobe involvement was seen more frequently. 71 cases (52 %) had involvement of all the 5 lobes whereas single lobe involvement was seen in 15 cases (11%). In terms of axial distribution, peripheral distribution was the commonest, seen in all cases (100 %) among which 73 (53.6 %) had only peripheral distribution whereas as 63 (46.3%) had both peripheral and central distribution. None of the patients showed purely central distribution. Similarly, with regards to the anterior-posterior distribution, 34 (25 %) had only posterior distribution whereas 102 (75%) had combined posterior and anterior distribution. With regards to the type of opacity, GGO was the dominant abnormality, found in all 136 cases (100%) cases. Pure GGO was observed in 42 (31%), GGO with interlobular septal thickening and intralobular lines, producing crazy paving pattern was seen in 38(28%) and GGO mixed with consolidation was noted in 57 (42%). None of the patients showed pure consolidation. Reticulations were seen in 57 (42 %). Some of cases- 32 (23%) showed subpleural curvilinear lines .Few of the cases also showed air bronchogram sign (23.2 %) and atoll or reverse halo sign (11%) . Bronchial wall thickening was observed in 14 (10 %) and bronchodilatation was seen in 26 (19 %). We observed peri-lesional or intralesional segmental or subsegmental vessel enlargement in 97 (71 %) cases . None of the patients showed halo sign or cavitation. 13 cases (9.6 %) showed pleural effusion. Interestingly, these patients had coexisting comordities viz. chronic kidney disease, SLE and cardiac failure. Few of the cases with coexisting comorbidities also showed pericardial effusion. Small percentage of the cases ( 9%) had reactive mediastinal lymphadenopathy. Such cases had a CT severity index above than 10.0.
Table 3: Distribution of lung findings on chest CT
Table 4: Type of lung opacities and additional findings on CT
Figure 1: Non-contrast axial chest CT images in lung window settings of a 51-year old male COVID-19 positive patient with complains of fever and sore throat showing ground glass opacity with bronchial dilation in right lower lobe.
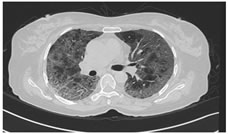
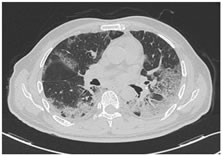
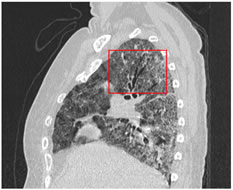
Figure 2: A 60-year-old female COVID-19 patient presenting with fever, breathlessness and dry cough. NCCT scan shows diffuse GGO with interlobular septal thickening giving rise to crazy paving pattern in bilateral lungs predominantly peripheral in distribution. Figure 3: A 66-year-old female COVID-19 patient presenting with fever and dry cough. NCCT scan shows diffuse GGO with interlobular septal thickening giving rise to crazy paving pattern in bilateral lungs predominantly peripheral in distribution. Figure 4: Sagittal reconstruction of the same patient showing diffuse GGOs and crazy paving pattern with bronchial dilatation (box). Figure 5: Non-contrast axial chest CT images in lung window settings of a 71-year old male COVID-19 positive patient with complains of breathlessness and fever showing patchy areas ground glass opacity in bilateral lungs with intralobular septal thickening. There is also an additional finding of vessel widening within the area of GGO as seen in right lower lobe (box). Figure 6: Non-contrast axial chest CT images in lung window settings of a 69 year old male COVID-19 positive patient with complains of breathlessness and fever showing bilateral perihilar consolidation with central clearing on right side( atoll sign) and bilateral pleural effusion. This patient had co morbidities viz diabetic mellitus, chronic kidney failure and hypertension.
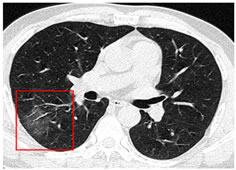
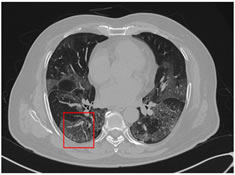
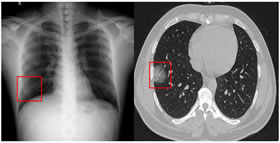
Figure 7: Chest radiograph of 37 year old COVID-19 positive male with complains of myalgia and fever, showing subtle patchy area of ground glass opacity in right lower zone. Non-contrast axial chest CT image in lung window of the same patient showing a well demarcated round area of ground glass opacity in subpleural location in lateral basal segment of right lower lobe lung with bronchiolar dilatation.
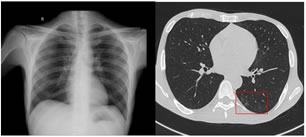
Figure 8: 45 year old patient with complaints of fever and myalgia. Chest radiograph appears normal. . Non-contrast axial chest CT image in lung window of the same patient shows peripheral patchy areas of ground glass opacities in basal segments of left lower lobe
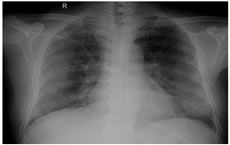
Figure 9: Chest radiograph of 48 year old male COVID-19 positive patient showing bilateral peripheral ground glass opacities in bilateral mid and lower zones.
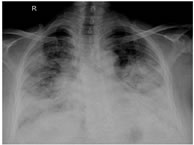
Figure 10: Chest radiograph of 55 year old female COVID-19 positive patient with fever and breathlessness showing multifocal areas of consolidations and ground glass opacities in bilateral mid and lower zones, predominantly in peripheral location.
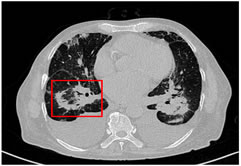
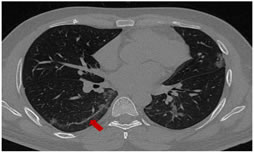
Figure 11: NCCT thorax of this 34 year old male COVID-19 positive patient showing multifocal peripheral GGOs in bilateral lungs and subpleural line (arrow) in right lower lobe.
DISCUSSION Out of 200 patients who were RT-PCR positive for COVID-19, 84 patients had abnormal finding on chest radiograph. Fifty two patients who had negative CXRs in our study demonstrated ground glass opacities on HRCT. Ground glass opacities were the most common radiographic feature in COVID-19 positive cases followed by consolidation in our study. The distribution of the abnormal findings was most commonly seen in peripheral and lower zones with bilateral involvement. Pleural effusion was relatively an uncommon finding seen in patients with preexisting co-morbidities like CKD and cardiac failure. These findings are in keeping with multiple studies done in China. 15, 16, 17, 18 Ng M-Y, Lee EY, Yang J, et al. and Yoon SH, Lee KH, Kim JY, et al. witnessed consolidation as the most common chest radiograph finding in their studies.19,20] We demonstrated that the common CT findings of bilateral involvement, peripheral distribution, and lower zone dominance can also be appreciated on CXR. The proportion of patients in our study exhibiting abnormal radiographic findings (51/64, 80%) is higher than that in the case series of 9 patients published by Yoon et al.21 (5/9, 56%). Furthermore, CXR abnormalities were detectable in 6 patients whose initial RT-PCR was negative (6/64, 9%). All positive CXRs in our study were also positive on CT. Chest CT manifestations of COVID-19 pneumonia have been widely reported. These studies have mainly come from China and European countries. Very few imaging data of Indian patients is available. It has been observed that positive chest CT can be seen even in asymptomatic patients. The opposite has also been seen, wherein symptomatic patients had a negative CT especially during the early phase o the illness.21 CT positivity in our study was 68% that is 136 patients out of 200 RT-PCR confirmed SARS CoV-2 cases showed abnormality on HRCT. We reported a negative CT in 64/200 ( 32%) patients with RT-PCR confirmed SARS-CoV-2. Studies from China, Korea and Europe have reported lung parenchymal abnormalities in 61%–100% RT-PCR positive patients.22,23,24 Li K et.al reported a CT positivity rate of 71.8 % in confirmed COVID-19 cases with clinical symptoms. Caruso D et.al 25 reported pulmonary findings in 96.6 % of symptomatic cases on CT. Ai T et al. 26 reported CT findings in 888 (88.7 %) among the total study population of 1014 COVID-19 patients. They further observed that 3% RT-PCR positive cases with clinical symptoms had a normal CT scan. Bao C et al. 27 in a meta-analysis of 13 studies with 2378 COVID- 19 cases found a pooled positive rate of 89.7 % for CT. An Indian study by Arshed Hussain Parry, Abdul Haseeb Wani, Mudasira Yaseen et al.. who studied spectrum of chest computed tomographic (CT) findings in coronavirus disease-19 (COVID-19) patients across four hospitals in Srinagar, Jammu and Kashmir noticed CT positivity in 51 out 147 patient (34.7 %).This is lower than our study and other studies mentioned above. We along with study done in Jammu and Kashmir recorded slightly lower number of CT positive cases in laboratory confirmed symptomatic SARS-CoV-2 patients as compared to the reported data from other countries. This could be due to varying disease course in different populations. Presumptive factors could account for such variation. Firstly it could be because CT scans were performed in symptomatic RT-PCR positive patients CT regardless of the severity of symptoms, with most patients having a mild illness. In our study the most common encountered symptom was fever ( 59%, 118/200). We also observed a low prevalence of comorbidities in our study cases with no known immune compromised patients (like cancer patients on chemotherapy) which also could have contributed to low CT positivity rate. Studies have shown that comorbid illnesses are known to be associated with increased severity of COVID-19 disease.28 On the other hand, it may be reflective of a less severe form of the disease in our country which is indicated by low case fatality rate in our population so far. However, these presumptive explanations needs confirmation by appropriate studies. However, initial negative CT may have developed lung changes subsequently during the course of illness. Thus the lack of follow-up imaging hinders us from confidently denying this possibility. Among the patients with lung parenchymal abnormalities on chest CT, bilateral and multilobar distribution of pulmonary opacities with peripheral dominance was observed. Our results fairly endorses the distribution and type of pulmonary opacities reported in COVID-19 pneumonia. GGO in the form of pure GGO, GGO with superimposed crazy paving pattern or GGO with consolidation was the most frequently observed lung parenchymal abnormality seen in all the cases. These findings are in congruence with the systematic review by Salehi et al.29 wherein they found that GGO was present in 88 % cases across 22 studies reported from various countries. Segmental or subsegmental intra-lesional or peri-lesional pulmonary vessel enlargement was observed in 70.6 % patients. Our findings are also in consonance with Yan Li et al.30 who reported vascular enlargement in 82.4 % and Caruso D et al.31 who reported vessel enlargement in 89 % patients. vasodilatation induced by the release of proinflammatory cytokines, small vessel pulmonary embolism and infection induced pulmonary vacuities could account for this unique finding of vascular enlargement.32 This seems to have a diagnostic value as it has not been reported previously in any infectious disease settings. The presence of enlarged vessel sign may help discriminate COVID-19 pneumonia from non−COVID-19 pneumonia. We did not observe nodules, pleural effusion, mediastinal lymphadenopathy in high rates. We did not observe cavitation in any of the cases on HRCT. Pleural effusion was seen mostly in patients with pre-existing co morbidities like CKD, cardiac failure. Small percentage of the cases ( 9%) who had reactive mediastinal lymphadenopathy had a CT severity index above than 10.0. There were some limitations in our study. Firstly, we did not follow up the patients who did not show any radiological abnormalities on imaging, who could have developed abnormalities in later stages of the disease. Also some patients may have received medical intervention once suspected or confirmed to have infection (perhaps antimicrobial therapy, fluid administration, or steroid therapy may affect chest CT findings), which was not documented in our study. In our study, our focus was on spectrum of the disease, rather than the temporal evolution of the radiological findings.
CONCLUSION We found that most common radiographic feature in COVID-19 is peripheral ground glass opacities in bilateral lower zones which was also the most common finding noted in HRCT lung. CT demonstrated higher sensitivity when it comes in picking up ground glass opacities. Additional findings of crazy paving, sub pleural lines, and vascular dilatation within GGOs were seen in significant number HRCTs of COVID-19 positive patients making these findings a diagnostic aid for COVID-19 pneumonia. Approximately one third symptomatic COVID-19 patients did not show any radiological abnormality even on HRCT.
REFERENCES
Policy for Articles with Open Access: Authors who publish with MedPulse International Journal of Radiology (Print ISSN: 2579-0927) (Online ISSN: 2636-4689) agree to the following terms: Authors retain copyright and grant the journal right of first publication with the work simultaneously licensed under a Creative Commons Attribution License that allows others to share the work with an acknowledgement of the work's authorship and initial publication in this journal. Authors are permitted and encouraged to post links to their work online (e.g., in institutional repositories or on their website) prior to and during the submission process, as it can lead to productive exchanges, as well as earlier and greater citation of published work.
Height, IVDL-Intervertebral Disc Length
Policy for Articles with Open Access
Authors who publish with MedPulse International Journal of Radiology(Print ISSN: 2579-0927) (Online ISSN: 2636 - 4689) agree to the following terms: Authors retain copyright and grant the journal right of first publication with the work simultaneously licensed under a Creative Commons Attribution License that allows others to share the work with an acknowledgement of the work's authorship and initial publication in this journal. Authors are permitted and encouraged to post links to their work online (e.g., in institutional repositories or on their website) prior to and during the submission process, as it can lead to productive exchanges, as well as earlier and greater citation of published work. |
|
|||||||||||||||||||||||||||||||||||||||||||||||||||||||||||||||||||||||||||||||||||||||||||||||||||||||||||||||||||||||||||||||||||||||||||||||||||||||||||||||||||||||||||||||||||||||||||||||||||||||||||||||||||||||||||||||||||||||||||||||||||||||||||||||||||||||||||||||||||||||||||||||||||||||
 This work is licensed under a Creative Commons Attribution-NonCommercial 4.0 International License.