 Home
Home
|
Table of Content Volume 17 Issue 3 - March 2021
Magnetic resonance imaging evaluation of degenerative changes of cervical spine
R Deepu1*, A Venkateshwaran2
1Assistant Professor, 2Professor & HOD, Department of Radio Diagnosis, Karpaga Vinayaga Institute of Medical Sciences and Research Centre, Maduranthakam, Chennai, Tamil Nadu- 603308, INDIA. Email: drdeepurk@gmail.com
Abstract Background: Degenerative disc disease is an age-related condition caused by the degeneration of intervertebral discs and narrowing of intervertebral disc spaces. A significant rise in this condition is noted among the Indian population due to the lifestyle changes and poor ergonomics in the workplace. Magnetic Resonance Imaging is a useful tool in the diagnosis of degenerative disc disease. Aims and Objectives: To evaluate, characterize, and grade the degenerative changes of the cervical spine using MRI and to analyze the distribution pattern of different grades of cervical spine degenerative changes. Materials and Methods: A descriptive Cervical spine MRI Study was done in 150 patients from January 2020 to August 2020. Disc degeneration, posterior disc protrusion, anterior disc protrusion, narrowing of the disc space and foraminal stenosis were the degenerative changes analyzed. Findings were graded in each cervical disc level from C2-3 to C7-D1 level and the results were statistically analyzed. Results: Age was found to be a major factor influencing the frequency of degenerative disc disease. Male predominance was noted. Total 900 cervical intervertebral discs (from the 6 cervical intervertebral disc levels of 150 patients) were evaluated, i.e., C2-3 to C7-D1 level. Disc degeneration was maximum at the C5-6 level and least at the C7-D1 level. Posterior disc protrusion (50.9%) was the most frequent degenerative disc disease followed by disc degeneration (23.9%). The least common degenerative changes were narrowing of disc space (7.7%) followed by foraminal stenosis (27.9%). Disc Degeneration is noted in 23.9% discs. Conclusion: MRI with its excellent soft-tissue contrast and multiplanar imaging capability is the ideal imaging modality for the evaluation and grading of degenerative disc disease of the cervical spine. MRI based grading of degenerative disc disease may be used for better assessment of severity and follow up of degenerative disc disease. Keywords: Cervical Spine; Degenerative Disc Disease; Magnetic Resonance Imaging (mRI).
INTRODUCTION Degenerative Disc Disease (DDD) is considered to be a major cause of pain and disability in the adult working population1. It is an age-related condition caused due to the degeneration of intervertebral discs and the narrowing of intervertebral disc spaces. In the case of cervical DDD, the symptoms are mainly neck pain and stiffness. There is a significant rise in this condition among the Indian population due to the change in lifestyle and poor ergonomics in the workplace2. If the degeneration is severe then back pain and muscle weakness occur as well and cervical spine surgery is considered. To evaluate DDD different imaging modalities are used, but MRI is the preferred examination since it provides excellent soft tissue contrast, it does not involve ionizing radiation and is non-invasive. Using sagittal images of the cervical spine intervertebral disc spaces are measured and detects the degenerated discs. Computerized approaches for the detection of degenerated discs based on disc morphology have been proposed in the past3.The diagnosis of degenerative disc disease begins when a patient with neck pain consults a doctor. A complete physical examination of the neck, arms, and upper extremities and X-ray neck are done to evaluate. If degenerative disc disease is present, the x-rays will often show a narrowing of the spaces between the vertebral bodies, which indicates that the disc has become very thin or has collapsed. Bone spurs begin to form around the edges of the vertebral bodies and the edges of the facet joints in the spine. These bone spurs can be seen on an x-ray and they are called osteophytes4. As the discs collapse and bone spurs form, the space available for the nerve roots and the spinal cord starts to shrink. The nerve roots are especially vulnerable to compression at the exit of the spinal canal, the neuroforamen5. Magnetic resonance imaging (MRI) is a useful tool in the diagnosis of DDD. It can image through multiple sections of the spine and show any abnormality of soft tissues, nerves, and ligaments. The test also can be used to verify: loss of water in a disc, facet joint hypertrophy (enlargement), stenosis (narrowing of the spinal canal), or a herniated disc (protrusion or rupture of the intervertebral disc). It helps in determining where the nerve roots or spinal cord are being compressed. Thus MRI has become the most common test, to evaluate the cervical spine6.
Materials and methods A descriptive Cervical spine MRI Study was done in 150 patients referred to the Department of Radiodiagnosis at Karpaga Vinayaga Institute of Medical Sciences and Research Centre, maduranthakam, Chennai, tamil Nadu from January 2020 to August 2020 using 1.5T Siemens Somatoscope MRI machine. Disc degeneration, posterior disc protrusion, anterior disc protrusion, narrowing of the disc space, and foraminal stenosis were the degenerative changes analyzed. Findings in the patients studied were graded in each cervical disc level from C2-3 to C7-D1 level and the results were statistically analyzed. Inclusion criteria: All patients who are detected to have any of the following degenerative changes of the cervical spine: Disc degeneration, Posterior disc protrusion, Anterior disc protrusion, Narrowing of the disc space, Foraminal stenosis. Exclusion criteria: Patients who are detected to have cervical spine fracture. Patients with spinal cord lesions like intramedullary tumors, demyelination, etc. Post-operative patients. Patients who are diagnosed with spondylolisthesis. Protocol for MRI cervical spine: Sagittal fast spin-echo (FSE), T2 weighted images (TR=4000 ms, effective TE 105 ms, 8 echo train length with 15 mech spacing, 3 excitations, 256 x 224 matrix, 16 kHz bandwidth) to include cerebellar tonsils to D1 vertebra level. Field of view: 26-28cm, slice thickness = 3-4mm, intersection gap =1mm.Axial T2 weighted images contiguous to cover at least C2-3 through C6-7 Field of view: 20cm, reconstructed thickness = 2mm, matrix = 256 x224.Sagittal spin-echo (SE) T1 weighted images (TR=500 ms, TE=14 ms, 3 excitations average, 256 x 224 matrix), to include cerebellar tonsils to D1vertebra level. Field of view: 26-28cm, thickness = 3-4mm, intersection gap = 1mm.Phased array spine coils are used, with the patient in the supine position. The observations of 150 patients who were referred for complete cervical spine MRI cases were compiled and analyzed. Findings in the patients studied were graded in each cervical disc level from C2-3 to C7-D1 level (total 6-disc levels ie 900 cervical intervertebral discs evaluated) tabulated using Microsoft Excel and has been given as Annexure. Statistical analyses were conducted using SPSS 16.0 for windows (SPSS Inc, Chicago, USA). Grading of the cervical spine degenerative changes was done using the following grading system7:
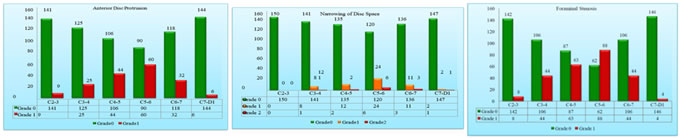
Results The age of the patients studied ranged from 16 years to 85 years. The patients involved in the study were divided into 4 age groups: less than 30, 31-45, 46-60 and greater than 61 years. There were 29 (19.3%) patients in the less than 30 years of age group, 53 (35.3%) patients in the 31-45 age group, 47 (31.3%) patients in the 45-60 age group and 21 (14.0%) patients in the greater than 61 age group. Of the 150 patients studied, 83 (55.3%) patients were males and 67 (44.7%) patients were females. In the less than 30 years age group, of the 29 patients, 15 (51.7%) were males and 14 (48.3%) were females. In 31-45 years age group, of the 53 patients, 31 (41.5%) were males and 22 (58.5%) were females. In the age group of 45-60 years, of the 47 patients, 21 (44.7%) were males and 26 (55.3%) were females. Among the patients who are greater than 61 years, of the 21 patients, males were 16 (76.2%) and females were 5 (23.8%). Total 900 cervical intervertebral discs were evaluated from 6 levels i.e., C2-3 to C7-D1 level. Age wise distribution of Disc Degeneration and level wise distribution of Disc Degeneration, Posterior disc protrusion, Anterior disc protrusion, Narrowing of disc space and foraminal stenosis were analyzed. In the Age wise distribution of disc degeneration studied, in the C2-3 Disc Degeneration , of the 29 patients in the less than 30 years age group 25 (16.7%) patients had grade 0 and 4 (2.7%) patients had grade 1 disc degeneration. None of the patients had grade 2 disc degeneration. Of the 53 patients in 31-45 years age group, 51 (34.0%) patients had grade 0 and 2 (1.3%) patients had grade 1 disc degeneration. None of the patients had grade 2 disc degeneration. Of the 47 patients in 46-60 years age group, 36 (24.0%) patients had grade 0 and 11 (7.3%) patients had grade 1 disc degeneration. None of the patients had grade 2 disc degeneration. Of the 21 patients in the greater than 61 years age group, 12 (8.0%) patients had grade 0, 5 (3.3%) patients had grade 1 and 4 (2.7%) patients had grade 2 disc degeneration. In the C3-4 Disc Degeneration, of the 29 patients in less than 30 years age group 25 (16.7%) patients had grade 0 and 4 (2.7%) patients had grade 1 disc degeneration. None of the patients had grade 2 disc degeneration. Of the 53 patients in 31-45 years age group 47 (31.3%) patients had grade 0 and 6 (4.0%) patients had grade 1 disc degeneration. None of the patients had grade 2 disc degeneration. Of the 47 patients in 46-60 years age group 35 (23.3%) patients had grade 0 and 11 (7.3%) patients had grade 1 disc degeneration. One (0.74%) of the patient had grade 2 disc degeneration. Of the 21 patients in the greater than 61 years age group 8 (5.3%) patients had grade 0, 9 patients (6.0%) had grade 1 and 4 (2.7%) patients had grade 2 disc degeneration. In the C4-5 Disc Degeneration, of the 29 patients in less than 30 years age group 24 (16.0%) patients had grade 0 and 5 (3.3%) patients had grade 1 disc degeneration. None of the patients had grade 2 disc degeneration. Of the 53 patients in 31-45 years age group 42 (28.0%) patients had grade 0 and 11 (7.3%) patients had grade 1 disc degeneration. None of the patients had grade 2 disc degeneration. Of the 47 patients in 46-60 years age group 34 (22.7%) patients had grade 0 and 13 (8.7%) patients had grade 1 disc degeneration. None of the patients had grade 2 disc degeneration. Of the 21 patients in the greater than 61 years age group, grade 0 and grade 1 disc degeneration was found in 8 (8.0%) patients and 5 (3.3%) patients had grade 2 disc degeneration .In the C5-6 Disc Degeneration ,of the 29 patients in less than 30 years age group 24 (16.0%) patients had grade 0 and 5 patients (3.3%) had grade 1 disc degeneration. None of the patients had grade 2 disc degeneration. Of the 53 patients in 31-45 years age group 39 (26.0%) patients had grade 0 and 14 (9.3%) patients had grade 1 disc degeneration. None of the patients had grade 2 disc degeneration. Of the 47 patients in 46-60 years age group 29 (19.3%) patients had grade 0, 17 (11.3%) patients had grade 1 and 1 patient had grade 2 disc degeneration. Of the 21 patients in the greater than 61 years age group, 7 (4.7%) patients had grade 0, 7 (4.7%) patients had grade 1 and 7 (4.7%) patients had grade 2 disc degeneration. In the C6-7 Disc Degeneration, of the 29 patients in less than 30 years age group 24 (16.0%) patients had grade 0 and 5 (3.3%) patients had grade 1 disc degeneration. None of the patients had grade 2 disc degeneration. Of the 53 patients in 31-45 years age group 42 (28.0%) patients had grade 0 and 11 (7.3%) patients had grade 1 disc degeneration. None of the patients had grade 2 disc degeneration. Of the 47 patients in 46-60 years age group 33 (22.0%) patients had grade 0, 13 (8.7%) patients had grade 1 and 1 (0.7%) patient had grade 2 disc degeneration. In the greater than 61 years age group, of the 21 patients, 8 (5.3%) patients had grade 0, 6 (4.0%) patients had grade 1 and 7 (4.7%) patients had grade 2 disc degeneration. In the C7-D1 Disc Degeneration, of the 29 patients in less than 30 years age group all the patients (16.7%) had grade 0 and none of the patients had grade 1 or 2 disc degeneration. Of the 53 patients in 31-45 years age group 50 (33.3%) patients had grade 0 and 3 (2.0%) patients had grade 1 disc degeneration. None of the patients had grade 2 disc degeneration. Of the 47 patients in 46-60 years age group 41 (27.3%) patients had grade 0 and 5 (7.3%) patients had grade 1 disc degeneration. None of the patients had grade 2 disc degeneration. Of the 21 patients in the greater than 61 years age group 12 (8.0%) patients had grade 0, 6 (4.0%) patients had grade 1 and 2 (2.0%) patients had grade 2 disc degeneration. Among the total 900 cervical intervertebral discs evaluated, Disc Degeneration is noted in 215 (23.9%) discs, of which 33 (3.7%) were of grade 2 disc degeneration. Maximum degenerative changes are noted at the C5-6 level followed by C4-5, C3-4, C6-7, and C2-3 intervertebral discs. The mildest degenerative disc disease was noted at the C7-D1 intervertebral disc. Posterior disc protrusion is noted in 458 (50.9%) discs, of which 38 (4.2%) discs were of grade 2 posterior disc protrusion. Anterior disc protrusion is noted in 176 (19.6%) discs. Narrowing of disc space is noted in 70 (7.7%) discs, of which 13 (1.4%) discs were of grade 2 narrowing and 251 (27.9%) discs showed foraminal stenosis. Posterior disc protrusion with compression of the spinal cord was most common at C5-C6, followed by C4-C5 and C6-C7. ADP, NDS and FS also follows similar pattern in terms of frequency. C7-D1 discs were not evaluated Posterior disc protrusion was maximum at C5-6 intervertebral disc (127 of 150 discs, 85.4%) followed by C4-5 (111 of 150 discs, 74.0%) and C6-7 discs (84 of 150 discs, 56.0%).Disc degeneration (51 discs, 35%), Anterior disc protrusion (60 discs, 40%),Narrowing of disc space (30 discs, 20%) and Foraminal stenosis (88 discs, 58.7%) were also found maximum at C5-6 level. The least amount of degenerative disc disease was found at C7-D1 level followed by C2-3.Posterior disc protrusion (18 discs, 12.0%), Disc degeneration (18 discs, 12.0%), Anterior disc protrusion (6 discs, 4.0%) and foraminal stenosis (4 discs, 2.7%) were found least at C7-D1 level, while none of the C2-3 level disc showed narrowing of disc space. At C7-D1 level there were 3 discs (2.0%) which showed narrowing of disc space.
graph 1 graph 2 graph 3 graph 4 graph 5 graph 6
graph 1: Age wise distribution of cases; graph 2: Level wise Distribution of Disc Degeneration; graph 3: Level wise Distribution of Posterior Disc Protrusion; Graph 4: Level wise Distribution of Anterior Disc Protrusion; graph 5: Level wise Distribution of Narrowing of Disc Spac; graph 6: Level wise Distribution of Foraminal Stenosis
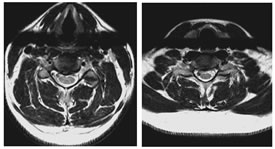
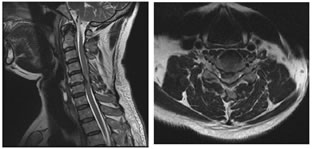
GRADE 1: DISC DEGENERATIONS, ANTERIOR and POSTERIOR DISC PROTRUSIONS FROM C3-C4 to C6-C7 LEVELS
GRADE 2: FORAMINAL STENOSIS GRADE 3: POSTERIOR DISC PROTRUSION AND FORAMINAL STENOSIS AT C5-C6 LEVEL DISCUSSION MRI may now be the appropriate first test for the evaluation of the cervical spine in a patient with symptoms referable to degenerative disease when therapeutic intervention is considered8. Modic M et al.9 suggested that an initial T1-weighted sagittal image with a 3-mm slice thickness will provide excellent contrast evaluation of the vertebral body marrow, disc space height, neural canal, and spinal cord. Disc herniation, canal stenosis, subluxation, and malalignment can be appreciated. If necessary, additional oblique views through the neural foramen can be obtained. Axial gradient-echo fast sequences with low flip angles, will provide a second orthogonal plane with increased conspicuousness of extradural changes relative to the neural foramen and thecal sac10. Regarding the reliability of a grading system for MR evaluation of degenerative changes of the spine, several studies are supporting MRI as a reliable modality for evaluation and grading of cervical spine degenerative changes11. Christe A et al.12 assessed cervical disc degeneration by examining 4 features (osteophytes and/or disc narrowing, disc prolapse, annular tears, and decrease in signal intensity) by using MRI and assigned a grade based on some findings. However, reproducibility studies on grading systems for cervical intervertebral disc degeneration are rare despite their clinical importance13. In our study, the disc degeneration is seen to follow a linear association with age. We found that disc degeneration is least in less than 30 years age group with 152 (86.9%) normal discs and 23 (13.1%) discs with grade 1 changes, while none of the discs showed grade 2 degeneration. The maximum amount of disc degeneration is noted in the age group of greater than 60 years. Here, only 55 discs (43.7%) were normal. 42 (33.3%) discs were grade 1 and 29 (23.0%) discs were grade 2. Similar trend is noted in the case of anterior disc protrusion, narrowing of disc space, and also in foraminal stenosis14. Posterior disc protrusion showed a deviation from this trend. In the age group of 46- 60 years, the percentage of discs with grade 1 posterior disc protrusion (57.1%) are slightly more than that of in the greater than 60 years (56.3%) age group. However, the percentage of discs with grade 2 changes are more in the elder age group (13.5%) compared to the age group of 46-60 years (3.2%). This indicates that age is a factor that influences the degenerative changes of the cervical spine. In the literature, multiple studies derived similar inferences15. Okada E et al.16 found in his study that the prevalence of degenerative changes increased with aging. Here MRI of the cervical spine was repeated in healthy subjects approximately 10 years after the prior MRI study. Progression of disc degeneration on MRI during the 10 years was found in 84.8% of the subjects16. Progression of decrease in the signal intensity of the disc, anterior compression of the dura and the spinal cord, and PDP was more frequently observed in subjects 20 to 49 years of age, whereas the progression of NDS and FS were more frequent in the elderly groups. There was a positive correlation between the progression of disc degeneration on MRI and the age of the subjects and the clinical symptoms17. This was consistent with many previous reports. Intervertebral disc degeneration is known to occur as a result of natural aging under the influence of various environmental factors. Many studies have suggested that genetic factors play an important role in disc degeneration18. In a twin study, Lerski R et al.19 suggested an important genetic influence on variation in intervertebral disc degeneration. There is a linear association noted between each degenerative change viz. disc degeneration, posterior disc protrusion, anterior disc protrusion, narrowing of disc space, and foraminal stenosis with age. There is a sudden rise in the frequency of degenerative changes noted between the age groups 45-60 and greater than 60 years, except in the case of posterior disc protrusion. This can be attributed to the increased severity of degenerative disc disease in the elderly. Similar findings can be seen in the literature, where there is a linear association with aging and disc degeneration19. In our study male predominance of 1.2:1.0 note. In all the age groups, similar pattern of male predominance noted except in the age group of 46-60 years, where the ratio gets reversed (1.0:1.2) showing a female predominance. Male predominance in degenerative disc disease seen in this study is in consensus with Miller et al. study20 and attributed it to the higher mechanical stress combined with longer nutritional pathways for the earlier degeneration of male discs. In our study the disc degeneration is seen to follow a linear association with age. We found that disc degeneration is least in less than 30 years age group with 152 (86.9%) normal discs and 23 (13.1%) discs with grade 1 changes, while none of the discs showed grade 2 degeneration. Maximum amount of disc degeneration is noted in the age group of greater than 60 years. Here, only 55 discs (43.7%) were normal. 42 (33.3%) discs were grade 1 and 29 (23.0%) discs were grade 2. Similar trend is noted in the case of anterior disc protrusion, narrowing of disc space and also in foraminal stenosis. Posterior disc protrusion showed a deviation from this trend. In the age group of 46-60 years, the percentage of discs with grade 1 posterior disc protrusion (57.1%) are slightly more than that of in the greater than 60 years (56.3%) age group. However the percentage of discs with grade 2 changes are more in the elder age group (13.5%) compared to the age group of 46-60 years (3.2%). This indicates that age is a factor which influence the degenerative changes of the cervical spine. In the literature there are multiple studies which derived similar inference.21,22,23,24,25 Matsumoto M et al.7 in an MRI study of cervical discs of asymptomatic subjects found that highest number of positive findings were at C5-C6, followed by C6-C7 and C4-C5. MRI signs of degeneration were rare at C2-C3 and C3-C4. Posterior disc protrusion with compression of the spinal cord was most common at C5-C6, followed by C4-C5 and C6-C7. ADP, NDS and FS also follows similar pattern in terms of frequency. C7-D1 discs were not evaluated. Oda et al..26 found that cervical disc with maximum stress on motion is at C5-6 level. This could be the reason for the increase in frequency of degenerative changes at this level. Our study also revealed similar pattern in terms of maximum frequency. However, disc with second most common degenerative changes in our study is C4-5, unlike C6-7 in their study. This could be due to the difference in the type of population assessed. We found that posterior disc protrusion is the most common degenerative change, affecting 458 (50.9%) discs This is followed by foraminal stenosis (251 discs, 27.9%), disc degeneration (215 discs, 23.9%), and anterior disc protrusion (176 discs, 19.6%) and least common degenerative change being the narrowing of disc space affecting 70 (7.7%) discs. These findings are not in concordance with the studies done by Teressi et al.27 and Matsumoto M et al..7 where disc degeneration is the most common degenerative change followed by posterior and anterior disc protrusions. The least common degenerative change was foraminal stenosis followed by narrowing of disc space. Again this mismatch could be due to the difference in the type of population analyzed.
CONCLUSION MRI is the most accurate means of evaluating the cervical spine and intervertebral discs. MRI examination of the cervical spine is of proven value in the evaluation and grading of degenerative changes of the cervical spine. In the present study age of the patients ranged from 16-85 years with a mean of 44.42±14.64. Degenerative disc disease was found in individuals of all age groups and maximum patients who underwent MRI were between 31-45 years of age (35.3%). There is a linear association noted between degenerative changes and age.Male predominance noted in our study . Maximum degenerative changes are noted at the C5-6 level followed by C4-5, C3-4, C6-7, and C2-3 intervertebral discs. The mildest degenerative disc disease was noted at the C7-D1 intervertebral disc. Posterior disc protrusion (50.9%) was the most frequent degenerative disc disease followed by disc degeneration (23.9%). The least common degenerative changes were narrowing of disc space (7.7%) followed by foraminal stenosis (27.9%) Disc Degeneration is noted in 23.9% discs, of which 3.7% were of grade 2 disc degeneration. Posterior disc protrusion is noted in 50.9% discs, of which 4.2% discs were of grade 2 posterior disc protrusion. Anterior disc protrusion is noted in 19.6% discs. Narrowing of disc space is noted in 7.7% discs, of which 1.4% discs were of grade 2 narrowing. And 27.9% discs showed foraminal stenosis. Considerable variation is noted in the pattern of distribution of degenerative disc disease in the Indian population compared to the rest. MRI based grading of degenerative disc disease may be used for better assessment of severity and follow up of degenerative disc disease.
References
Policy for Articles with Open Access: Authors who publish with MedPulse International Journal of Radiology (Print ISSN: 2579-0927) (Online ISSN: 2636-4689) agree to the following terms: Authors retain copyright and grant the journal right of first publication with the work simultaneously licensed under a Creative Commons Attribution License that allows others to share the work with an acknowledgement of the work's authorship and initial publication in this journal. Authors are permitted and encouraged to post links to their work online (e.g., in institutional repositories or on their website) prior to and during the submission process, as it can lead to productive exchanges, as well as earlier and greater citation of published work.
Height, IVDL-Intervertebral Disc Length
Policy for Articles with Open Access
Authors who publish with MedPulse International Journal of Radiology(Print ISSN: 2579-0927) (Online ISSN: 2636 - 4689) agree to the following terms: Authors retain copyright and grant the journal right of first publication with the work simultaneously licensed under a Creative Commons Attribution License that allows others to share the work with an acknowledgement of the work's authorship and initial publication in this journal. Authors are permitted and encouraged to post links to their work online (e.g., in institutional repositories or on their website) prior to and during the submission process, as it can lead to productive exchanges, as well as earlier and greater citation of published work. |
|


 This work is licensed under a Creative Commons Attribution-NonCommercial 4.0 International License.